Figures & data
Table 1 Base Sequence of Primers Used in This Work
Figure 1 Differences in circRNA expression profile between GC tissues and paired adjacent normal tissues.
Notes: (A) The box plot showed variations in circRNA expression. (B) Scatter plots are used to evaluate the differences in circRNA expression. (C) Volcano plots illustrated differential circRNA expression, in which the red points represent the differentially expressed circRNAs with statistical significance. (D) The heatmap shows differentially expressed circRNAs in 5 GC tissues and paired adjacent normal tissues. Gene expression profiles are presented in rows. “Red” indicates high relative expression, and “blue” indicates low relative expression.
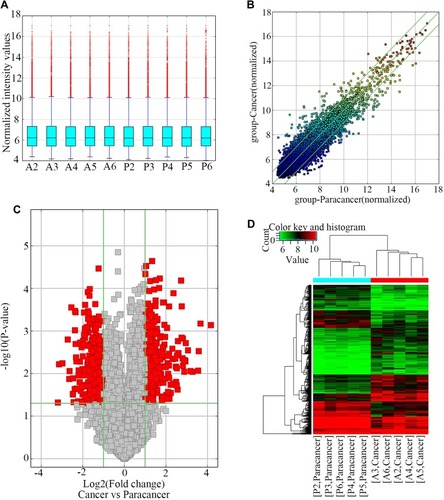
Table 2 The Differently Expressed circRNAs Between Gastric Cancer and Normal Gastric Tissues
Figure 2 Filtering and validation of differentially expressed circRNAs in GC.
Notes: (A, B) Based on differentially expressed circRNAs of our chip results, GEO DataSets were selected using Venn diagram. (C–E) qRT-PCR verified the expression of circRNA_104433 in GC cell lines, in which 61 GC patients and GC cells transfected with lentiviral vectors showed knockdown of circRNA_104433. All the data are presented as mean ± S.D. *P < 0.05, **P < 0.01.
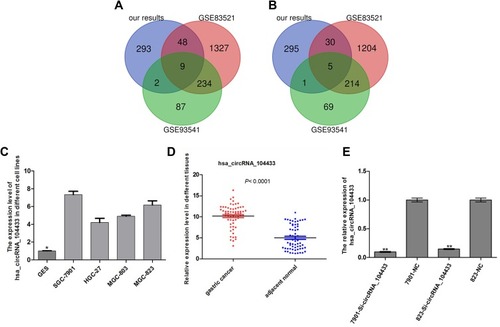
Table 3 Clinico-Pathological Variables and the Expression Level (△ct) of circRNA_104433 in Gastric Cancer Patients
Figure 3 The effect of knockdown of circRNA_104433 on cell cycle distribution and proliferation in GC cells.
Notes: (A) Flow cytometer assay was performed to assess the cell cycle. (B, C) The cell cycle distribution of each group was compared. (D, E) CCK8 assay was performed to assess cell proliferation. The OA value curve was used to compare cell proliferation of each group. All data are presented as mean ± S.D. *P < 0.05.
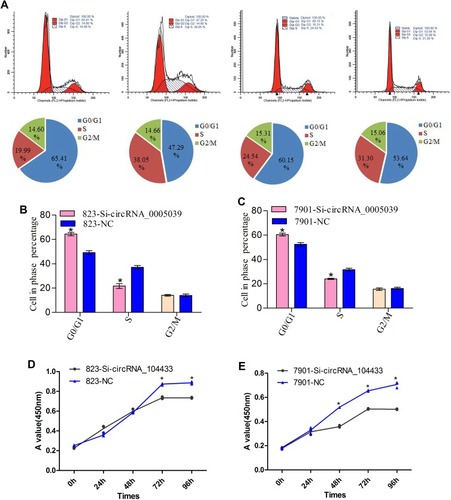
Figure 4 The effect of knockdown of circRNA_104433 on cell apoptosis and tumor growth of xenograft in GC.
Notes: (A, C, E) Flow cytometer assay, AO-EB double staining and Hoechst assay were performed to assess cell apoptosis, respectively. (B, D, F) The rate of cell apoptosis of each group was compared. (G) The images of transplanted tumors in each group (three per group) in nude mice. (H) The growth curve was used to compare the tumors of each group. The tumor volume was measured every four days. All data are presented as mean ± S.D. *P < 0.05.
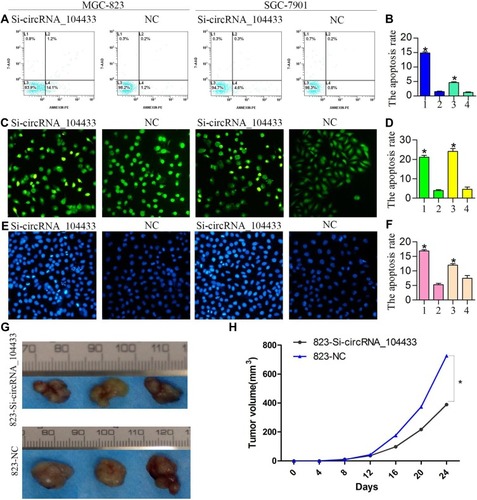
Figure 5 Confirmation of target gene.
Notes: (A) The base sequence of interaction of miR-497-5p and circRNA_104433 wild-type 3′-UTR and continuous missing style of 3′ UTR reporters. (B) The base sequence of interaction of miR-497-5p and CDC25A wild-type 3′-UTR and continuous missing style of 3′UTR reporters. (C, D) Comparison of differentially expressed luciferase activity in each group. (E, F) Comparison of differentially expressed miR-497-5p and CDC25A in each group. All data are presented as mean ± S.D. *P < 0.05, **P < 0.01.
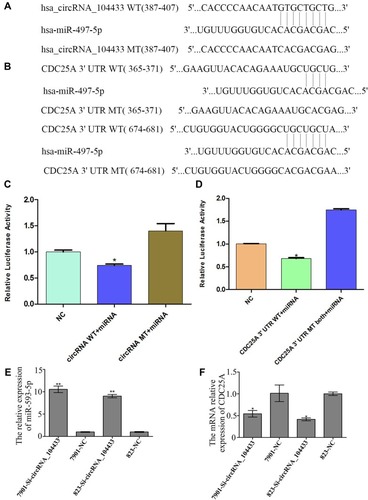
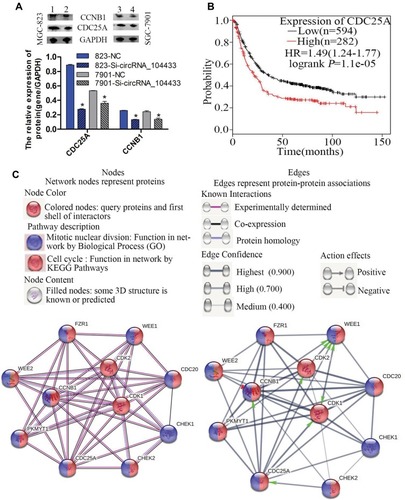
Figure 6 The prognosis of CDC25A and its related protein mechanism in GC cells.
Notes: (A) Images of genes and protein expressions were detected by Western blotting assay. Comparison of differentially expressed genes in each group. 1, 823-NC group; 2, 823-Si- circRNA_104433 group; 3, 7901-NC group, 4, 7901-Si- circRNA_104433 group. All data are presented as mean ± S.D. *P < 0.05. (B) The Kaplan Meier plot was performed to assess the effect of CDC25A gene expression on survival rate in 876 GC patients. Analysis of original microarray data on GEO DataSets with original microarray data (GSE14210, GSE15459, GSE22377, GSE29272, GSE51105, GSE62254). (C) The network proteins associated with CDC25A were analyzed using the online tool STRING version 10.5.