Figures & data
Table 1 Search strategy of CTC and exosome in colorectal cancer
Table 2 The biomarkers which worked for diagnostic of CRC in circulating tumor cells
Table 3 The biomarkers which worked for diagnostic of CRC in Exosome
Table 4 The biomarkers which worked for prognostic of CRC in circulating tumor cells
Table 5 The biomarkers which worked for prognostic of CRC in exosome
Figure 3 Network and enrichment analysis visualization. Combined screenshots from the STRING website, showing results obtained upon entering a set of 131 proteins suspected to be involved in circulating tumor cell markers. According on kmeans clustering has been selected, the corresponding protein nodes in three categories automatically highlighted in colors.
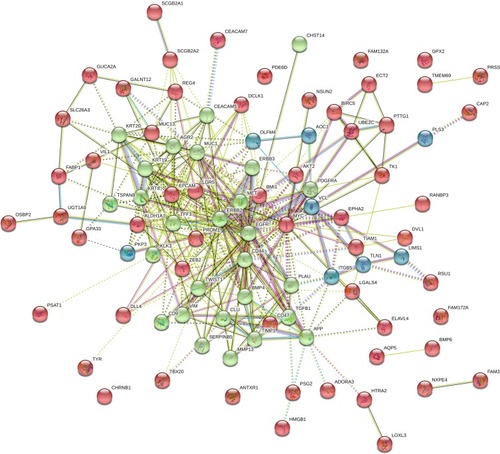
Figure 4 Network and enrichment analysis visualization. Combined screenshots from the STRING website, showing results obtained upon entering a set of 45 proteins suspected to be involved in Exosome markers. According on kmeans clustering has been selected, the corresponding protein nodes in three categories automatically highlighted in colors.
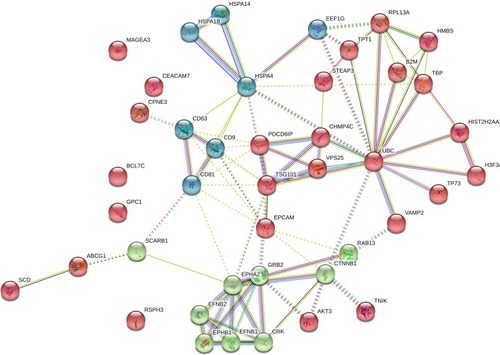
Figure 1 Design of PRISMA flow diagram explaining details of our search process was applied during the article selection for circulating tumor cell.
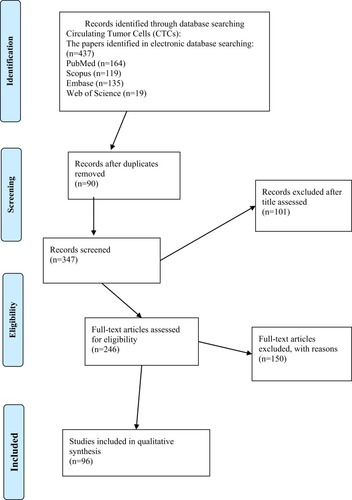
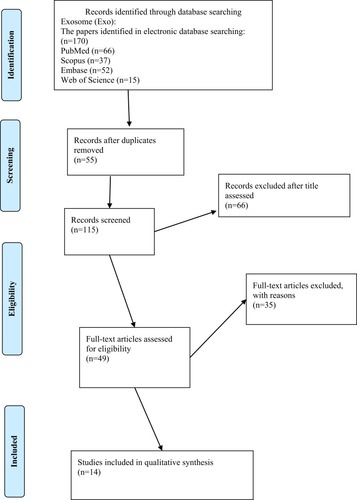
Figure 2 Design of PRISMA flow diagram explained details of our search process that applied during the article selection for Exosome.