Figures & data
Table 1 Baseline Characteristics Of The Study Population
Table 2 Baseline Characteristics Of Analysis Group
Figure 1 Difference of PIVKA and AFP plasma levels after logarithmic transformation between early HCC patients and liver cirrhosis in the analysis group. (A) Serum level of PIVKA-II among early HCC patients was 90.97 (9.7–30,766.38) mAU/mL, significantly higher than that of LC patients at 18 (3.49–626.34) mAU/mL (P < 0.01) in analysis group. (B) Serum level of AFP among early HCC patients was 15 (0.9–19,549.1) ng/mL, significantly higher than that of LC patients at 2.00 (0.6–121.8) ng/mL (P < 0.01) in analysis group.
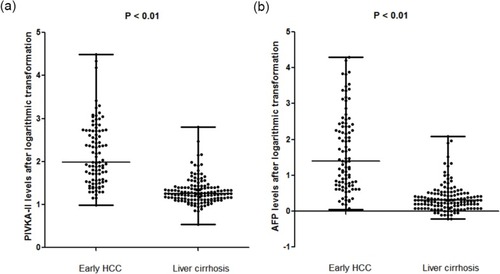
Figure 2 Diagnostic values of AFP (green), PIVKA-II (purple), the logistic regression model (blue), and the simple model (red) for early HCC detection among lLC patients in the analysis group.
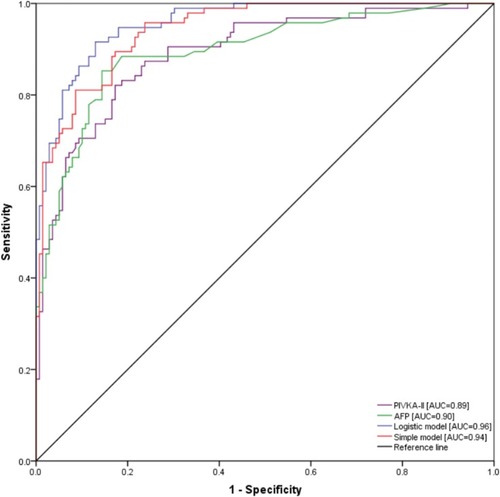
Table 3 Univariate And Multivariate Analyses Of All Characteristics In Analysis Group
Table 4 Baseline Characteristics Of Validation Group
Figure 3 Diagnostic values of the logistic regression model and the simple model for early HCC detection among LC patients in the validation group.

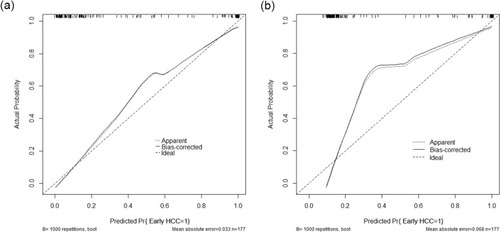
Figure 4 Validity of the predictive performance of the logistic model (A) and the simple model (B) in estimating the probabilities of early HCC in the validation group (n= 177).