Figures & data
Table 1 Correlation Between MTDH Expression And Clinicopathological Features Of GC
Figure 1 MTDH is significantly elevated in GC and promotes proliferation and clonogenicity in different GC cell lines. (A) mRNA expression of MTDH in GC and paired non-tumor mucosa (n=12). y-Axis indicates the ΔCt value. (B) Images of MTDH immunochemistry stain in non-tumor mucosa and primary cancer specimens were negative, low and high expressions as followed (magnification fold was 400×). (C) Bar chart summary of MTDH expressions in paired non-tumor mucosa and cancer tissues in b. + or - stand for high or low stain, respectively, and y-axis represents the number of cases in each group. (D) The MTDH levels in GC cell lines. (E) Western blot showed MTDH expression of transfection groups elevated versus control in MKN28 and AGS. (F) and (G) SiA sequence could significantly inhibit expressions of MTDH protein levels in MGC803 and MKN45. (H) MTS assays were performed in MTDH-upregulated MKN28 and AGS cells and MTDH-downregulated MGC803 and MKN45 cells. (I) and (J) The colony formation assay was carried out to detect colony formation ability. All experiments were repeated three times, *p<0.05, **p<0.01, ***p<0.001, ****p<0.0001.
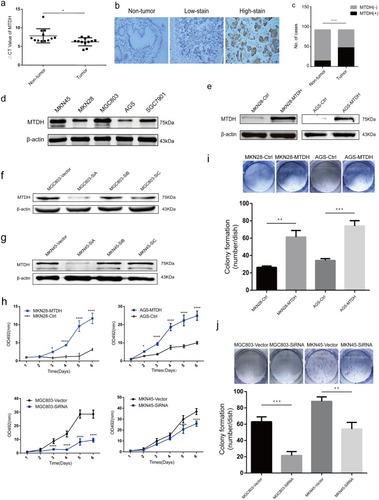
Figure 2 MTDH increases the migration and invasion capacity of GC cells and enhances 5-FU and Oxaliplatin chemoresistance. (A) Migration, (B) invasion assay showed that MTDH overexpression increased the cells numbers passing through membranes compared with control (p<0.05). Simultaneously, MTDH downregulation decreased the capability of migration and invasion versus vector (p<0.05). (C) And (D) to ascertain the effect of MTDH on drug resistance of GC cell lines, we tested drug sensitivity in MTDH-overexpression and downregulation cells at different concentration of oxaliplatin and 5-FU using an MTS assay. The results were shown as mean±SD. SD, standard deviation. All experiments were repeated three times, *p<0.05, **p<0.01, ***p<0.001, ****p<0.0001.
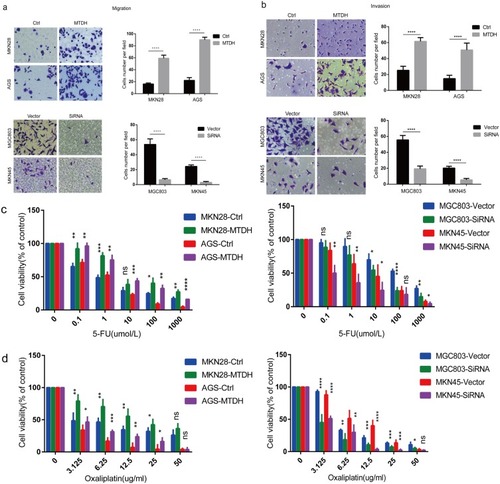
Figure 3 MTDH induces EMT and affects the subcellular translocation of β-catenin. (A) and (B) Immunohistochemical staining of vimentin and E-cadherin in GC samples (magnification, 400×). Statistical analysis showed that MTDH expressions were negatively correlated with E-cadherin expressions, while, positively correlated with vimentin expressions (P<0.05). (C) Immunohistochemical expression MTDH and β-catenin in human GC samples (magnification, 400×). (D) Western blot analysis of MTDH, E-cadherin, vimentin, phosphorylated β-catenin (p-β-catenin), β-catenin and LEF-1 in GC cell lines. (E) Immunofluorescence displayed that MTDH overexpression increased β-catenin nucleus ectopic expression. (F) Correspondingly, knockdown of MTDH decreased β-catenin nucleus expression (scale bar, 20 μm). (G) Co-immunoprecipitation (Co-ip) was carried out in MTDH-overexpressed cell line MKN28.
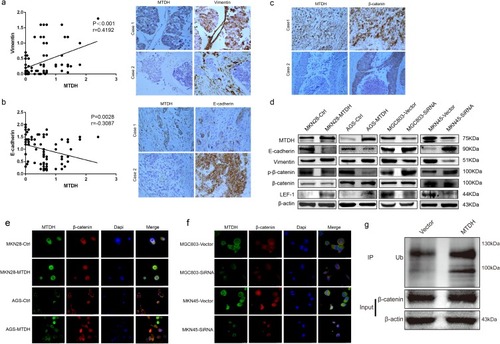
Table 2 Relationship Between MTDH And β-Catenin Expressions
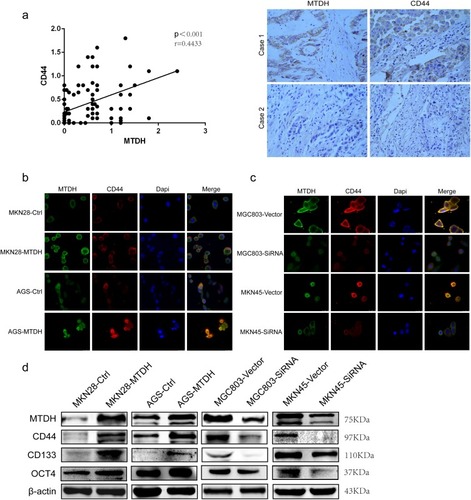
Figure 4 MTDH promotes CSCs-related markers expressions. (A) Immunohistochemical staining of stem cell marker CD44 in human GC samples, Spearman correlation analysis indicated that MTDH expressions were positively correlated with CD44 in 92 GC specimens. (B) and (C) Overexpression of MTDH increases expression of CD44, whereas downregulation of MTDH decreased protein expression of CD44 (scale bar, 20 μm). (D) Western blot indicated the correlation of MTDH and CSCs-related markers CD44, CD133 and OCT4 expressions in MKN28, AGS, MGC803 and MKN45 cell lines.