Figures & data
Figure 1 The expression of PRPH2 is downregulated in laryngeal cancer tissues, and DNA methylation suppresses PRPH2 expression. (A) The mRNA expression of PRPH2 in 16 cases of laryngeal cancer (n=16) and 12 cases of normal tissues (n=12). **P<0.01, Laryngeal cancer vs. normal tissues. (B) The mRNA expression of PRPH2 in 12 paired laryngeal cancer and normal tissues. **P<0.01, Laryngeal cancer vs. normal tissues (n=12 in each group). (C) The expression of PRPH2 was downregulated in 67.80% laryngeal cancer tissues (n=48). (D–F) Relative mRNA expression of PRPH2 in TU686 (D), M4e (E) and Hep-2 (F) cells after treatment with DAC and TSA (repeat 3 times for each group). *P<0.05, TSA 600nM vs. vehicle in TU686 cells; **P<0.01, DAC vs. vehicle, DAC+TSA vs. vehicle in TU686, M4E and TU686 cells.
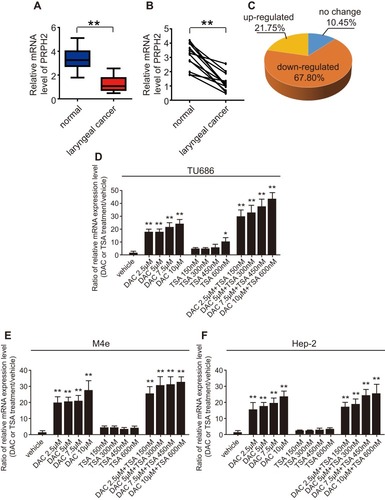
Figure 2 Overexpression of PRPH2 suppresses the invasion and anoikis inhibition of laryngeal cancer cells. (A) Expression of PRPH2 in laryngeal cancer cell lines, including Hep-2, TU212, TU686, M2e, M4e and AMC-HN-8 cells (repeat 3 times for each group). **P<0.01, TU686 or M4E vs. M2e or AMC-HN-8. (B and C) The protein expression levels of PRPH2 in TU686 (B) and M4E (C) cells, infected with Lenti-PRPH2 or Lenti-vector. Statistical analyses of PRPH2 expression in the two groups are shown below (repeat 3 times for each group). **P<0.01, Lenti-vector vs. Lenti-PRPH2. (D) Representative photos of invaded TU686 cells infected with Lenti-PRPH2 or Lenti-vector. Statistical analysis of invaded TU686 cells in the two groups is shown right (repeat 3 times for each group). **P<0.01, Lenti-vector vs. Lenti-PRPH2. (E) Flow cytometry analysis of anoikis of TU686 cells infected with Lenti-PRPH2 or Lenti-vector. Flow cytometry statistical analysis of apoptotic TU686 cells is shown right (repeat 3 times for each group). **P<0.01, Lenti-vector vs. Lenti-PRPH2. (F) Representative photos of invaded M4e cells infected with Lenti-PRPH2 or Lenti-vector. Statistical analysis of invaded M4e cells in the two groups is shown right (repeat 3 times for each group). **P<0.01, Lenti-vector vs. Lenti-PRPH2. (G) Flow cytometry analysis of anoikis of M4e cells infected with Lenti-PRPH2 or Lenti-vector. Flow cytometry statistical analysis of apoptotic M4e cells is shown right (repeat 3 times for each group). **P<0.01, Lenti-vector vs. Lenti-PRPH2.
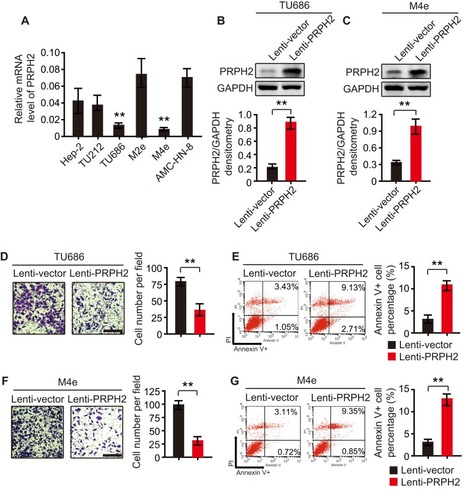
Figure 3 PRPH2 overexpression increases the phosphorylation of YAP/LATS1 and decreases Rho GTPases activities. (A) GESA analysis showed that PRPH2 was closely related with Hippo signalling pathway. (B) Western blot analysis of phospho-YAP, YAP, phospho-LATS1 and LATS1 in PRPH2 overexpressed and control TU686 cells (repeat 3 times for each group). Phospho-YAP/YAP and phospho-LATS1/LATS1 densitometry are shown on the right. (C) TU686 cells were serum starved for 24 h and the RhoA and Cdc42 activities were measured by pull-down assays in PRPH2 overexpressed and control cells (repeat 3 times for each group). Active-RhoA/total-RhoA and active-Cdc42/total-Cdc42 densitometry are shown on the right. (D) The mRNA levels of CTGF, ANKRD1 and CYR61 in PRPH2 overexpressed and control TU686 cells (repeat 3 times for each group). **P<0.01, Lenti-vector vs. Lenti-PRPH2.
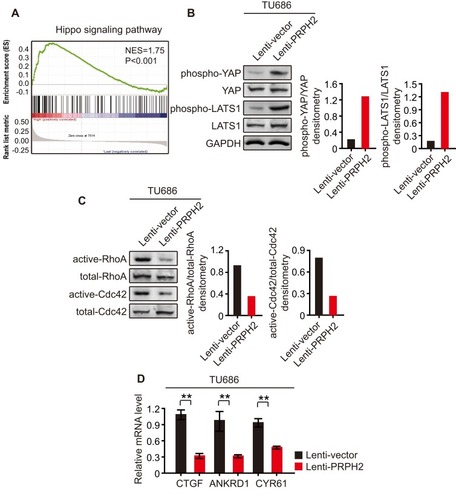
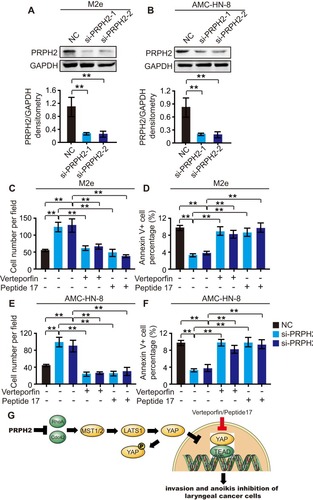
Figure 4 PRPH2 knockdown promotes the invasion and anoikis inhibition of laryngeal cancer cells, which can be abrogated by Hippo pathway inhibitors. (A and B) The protein expression level of PRPH2 in M2e (A) and AMC-HN-8 (B) cells, infected with siRNA of PRPH2 or negative control (NC). Statistical analyses of PRPH2 expression are shown below (repeat 3 times for each group). **P<0.01, NC vs. si-PRPH2-1 or si-PRPH2-2. (C and E) M2e and AMC-HN-8 cells were infected with siRNA of PRPH2 or NC, then treated with 50 nM Verteporfin (YAP-TEAD inhibitor) or 50 nM Peptide 17 (YAP-TEAD inhibitor), respectively. The invaded M2e (C) and AMC-HN-8 (E) cells were analysed after 48 hrs (repeat 3 times for each group). **P<0.01, NC vs. si-PRPH2-1 or si-PRPH2-2, si-PRPH2-1 vs. si-PRPH2-1+Veterporfin or si-PRPH2-1+Peptide17, si-PRPH2-2 vs. si-PRPH2-2+Veterporfin or si-PRPH2-2+Peptide17. (D and F) M2e and AMC-HN-8 cells were infected with siRNA of PRPH2 or NC, then treated with 50 nM Verteporfin or 50 nM Peptide 17, respectively. The apoptotic M2e (D) and AMC-HN-8 (F) cells were analysed after 48 hrs (repeat 3 times for each group). **P<0.01, NC vs. si-PRPH2-1 or si-PRPH2-2, si-PRPH2-1 vs. si-PRPH2-1+Veterporfin or si-PRPH2-1+Peptide17, si-PRPH2-2 vs. si-PRPH2-2+Veterporfin or si-PRPH2-2+Peptide17. (G) PRPH2 decreases Rho GTPases activities, and subsequently increases the phosphorylation of YAP/LATS1 and activates Hippo signalling, thereby suppressing laryngeal cancer cell invasion and anoikis inhibition.