Figures & data
Figure 1 NCK1-AS1 and miR-143 showed opposite expression patterns in UBC NCK1-AS1 (A) and miR-143 (B) expression level measurements and comparisons (UBC vs non-tumor) were performed by qPCR and paired t test, respectively. Three replicates were included and mean values were presented, *p<0.05.
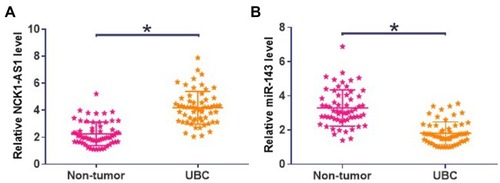
Figure 2 Alter expression levels of NCK1-AS1 and miR-143 in UBC tissues predicted poor survival with the mean NCK1-AS1 (A)/miR-143 (B) expression level in UBC as cutoff value, the 60 UBC patients were divided into high- and low-level groups (n=30). Survival curve plotting and comparison were performed by K-M plotter and Log-rank test, respectively.
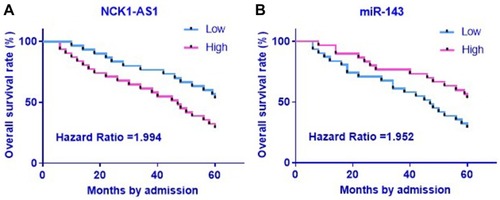
Figure 3 NCK1-AS1 and miR-143 were significantly and inversely correlated in UBC tissues correlations between the expression levels of NCK1-AS1 and miR-143 across UBC tissues (A) and non-tumor tissues (B) were analyzed by Pearson’s correlation coefficient. (C). The binding site between NCK1-AS1 and miR-143. (D). The luciferase reporter system was used to detect the interaction. *p<0.05.
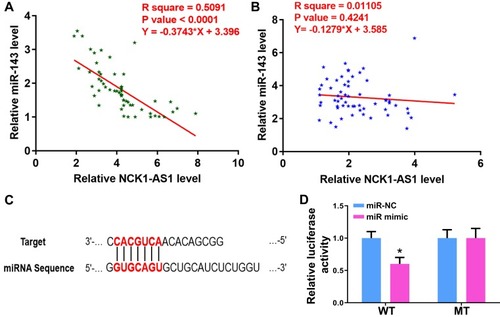
Figure 4 NCK1-AS1 overexpression mediated the downregulation of miR-143 in UBC cells HT-1376 and HT-1197 cells was transfected with NCK1-AS1 expression vector and miR-143 mimic. NCK1-AS1 and miR-143 overexpression were confirmed by qPCR at 48hrs post-transfection (A). The effects of NCK1-AS1 overexpression on miR-143 expression (B) and the effects of miR-143 overexpression on NCK1-AS1 expression were analyzed by qPCR (C). Three replicates were included and mean values were presented, *p<0.05.
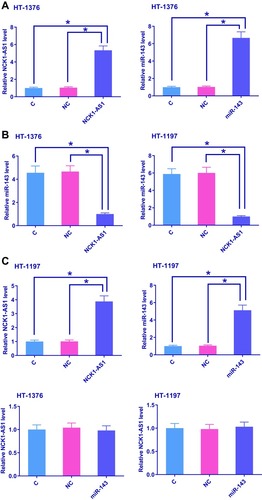
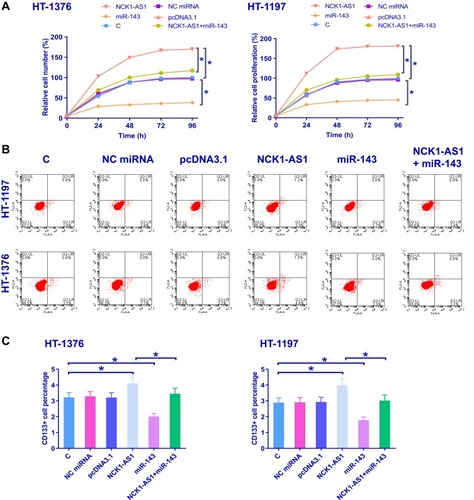
Figure 5 NCK1-AS1 regulated UBC cell proliferation and stemness through miR-143. Cell proliferation and stemness assays were used to analyze the effects of NCK1-AS1 and miR-143 overexpression on the proliferation (A) and CD133+ (B, C) of HT-1376 and HT-1197 cells. Three replicates were included and mean values were presented, *p<0.05.