
Figures & data
Figure 1 ITGA5 was upregulated in OSCC. (A) The expression difference of ITGA5 in TCGA database. (B) The relative mRNA level of ITGA5 of our own database. (C) The relative mRNA level of ITGA5 in different stages of tumour. (D) Western blot of ITGA5 in 12 paired OSCC and normal tissue. All the samples were taken from tongue. Stage I: sample 1.2. Stage II: sample 3.4. Stage III: sample 5.6.7. Stage IV: sample 8.9.10.*p<0.05, ***p<0.001.
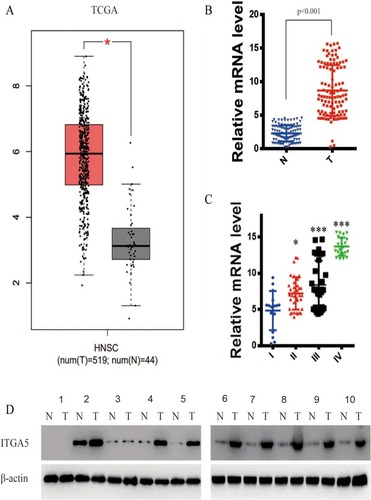
Table 1 The Clinical Characteristic Of Patients
Figure 2 ITGA5 was negatively correlated with prognosis. (A) The representative image of IHC, 200× scale 50μm, 400× scale 200μm. (B) The statistical analysis of IHC score in paired OSCC and normal tissue, all the tissues were taken from tongue. (C) Left, the survive curve of patients of own database, all the tissues were taken from tongue. Right, the survive curve of patients of TCGA database.
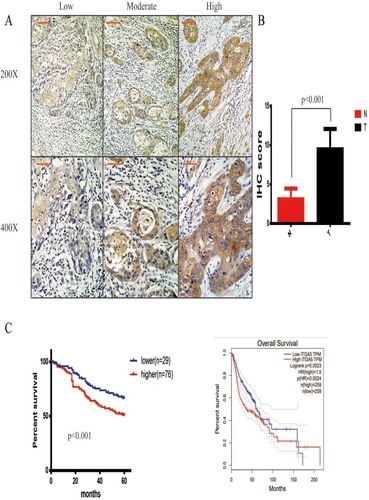
Figure 3 Stable cell line was successfully established. (A) The relative mRNA level of ITGA5 of different cell line. (B) The relative mRNA level of UM1 and UM2 cell line. (C) Western blot of ITGA5 in different cell line. *p<0.05.
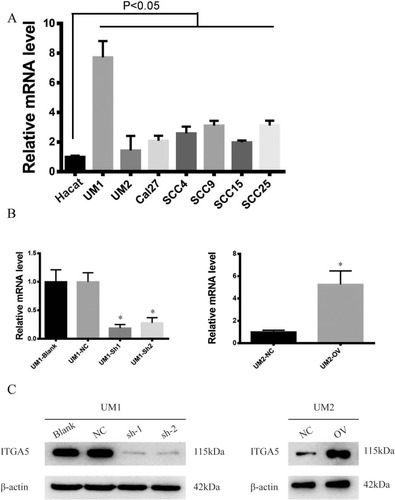
Figure 4 ITGA5 promotes the proliferation of OSCC. (A) The CCK-8 assay of OSCC cell line. (B) The colony formation assay of OSCC cell line. (C) The statistical analysis of colony index of OSCC cell line. (D) The representative image of Edu and DAPI of OSCC cell line. (E) The statistical analysis of percentage of Edu-positive cells of OSCC cell line. *p<0.05.
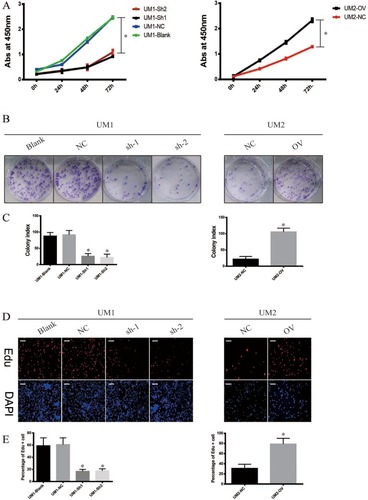
Figure 5 ITGA5 promotes the migration and invasion of OSCC. (A) The representative image of wound healing assay of OSCC cell line. (B) The statistical analysis of wound healing assay of OSCC cell line. (C) The representative image of trans-well assay and invasion chamber assay of OSCC cell line. (D) The representative image of Edu and DAPI of OSCC cell line. (E) The statistical analysis of percentage of Edu-positive cells of OSCC cell line. *p<0.05.
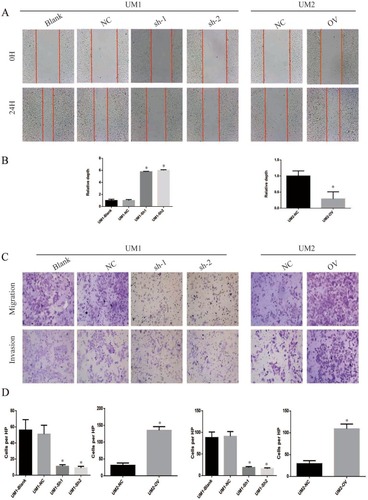
Figure 6 ITGA5 promotes the EMT of OSCC. (A) Western blot of EMT markers of OSCC cell line. (B) The relative mRNA level of EMT markers of OSCC cell line. *p<0.05.
