
Figures & data
Table 1 Comparison Of Two Treatment Groups Of Patients With Baseline Characteristics (Before And After PSM)
Figure 1 The flow diagram of this study.
Abbreviations: HCC, hepatocellular carcinoma; BCLC, Barcelona Clinic Liver Cancer; JSH, Japan Society of hepatology; LCSGJ, Liver Cancer Study Group of Japan; TACE, transcatheter arterial chemoembolization.
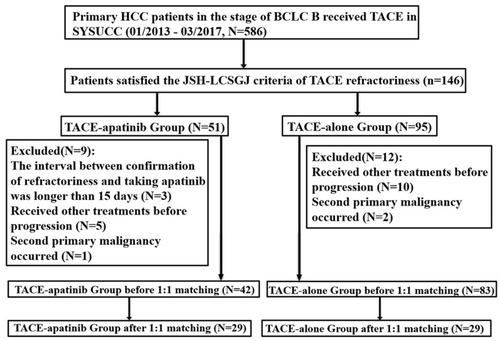
Table 2 The Comparison Of AEs Between Two Treatment Groups
Figure 2 Kaplan–Meier curves of OS for TACE+apatinib and TACE groups before (A) and after PSM (B).
Notes: The significant increase of OS can be both observed in the TACE-apatinib group compared with the TACE-alone group before (A) and after PSM (B).Abbreviations: OS, overall survival; TACE, transcatheter arterial chemoembolization; PSM, propensity score matching.
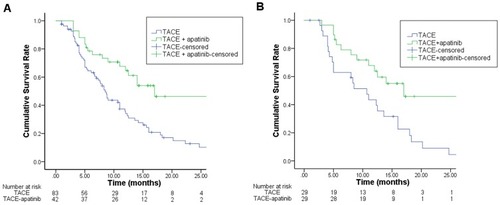
Figure 3 Kaplan–Meier curves of PFS for TACE+apatinib and TACE groups before (A) and after PSM (B).
Notes: The significant increase of PFS can be observed in the TACE-apatinib group compared with the TACE-alone group, especially after PSM.
Abbreviations: PFS, progression-free survival; TACE, transcatheter arterial chemoembolization; PSM, propensity score matching.
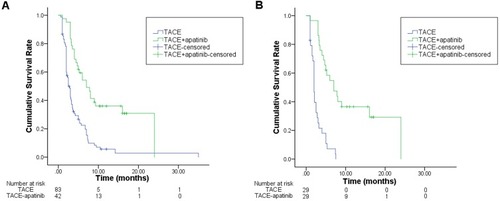
Table 3 Univariate And Multivariate Analysis Of Prognostics Factors Affecting OS For Two Treatment Cohorts
Table 4 Univariate And Multivariate Analysis Of Prognostics Factors Affecting PFS For Two Treatment Cohorts
Table 5 The Comparison Of Post-Treatments Between Two Groups After PSM