Figures & data
Figure 1 miR-520a-3p was significantly downregulated in GC. (A) The expression of miR-520a-3p was detected in GC tissues (n=90) compared with adjacent non-tumor tissues (n=90) using qRT–PCR. (B) The expression of miR-520a-3p was detected in GC tissues provided by patients with different stages of disease (TNM staging) using qRT-PCR. (C) The expression of miR-520a-3p in the gastric epithelial cell line GES-1 and five GC cell lines (ie, AGS, MKN-28, MKN-45, BGC-823, and SGC-7901) was detected using qRT–PCR. (D) Kaplan–Meier curve showing the survival in patients with GC divided according to the expression of miR-520a-3p. Patients were classified into low (red) and high expression (blue) group according to the median of miR-520a-3p expression. **P<0.01; ***P<0.001.
Abbreviations: GC, gastric cancer; TNM, tumor-nodes-metastasis; qRT-PCR, Quantitative real-time fluorescence PCR.
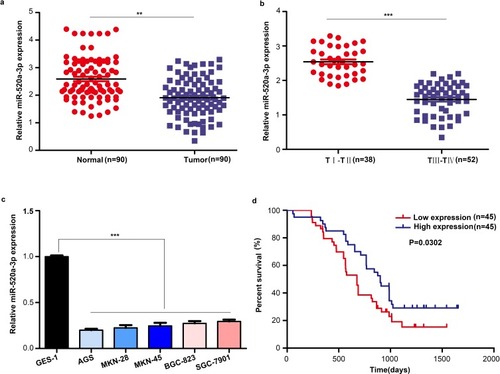
Figure 2 Overexpression of miR-520a-3p repressed the proliferation and glycolysis of GC cells in vitro. (A) qRT-PCR was used to detect the transfection efficiency of miR-520a-3p overexpression (LV-miR-520a-3p) and negative control lentiviruses (NC). (B) The effect of miR-520a-3p overexpression on the proliferation of GC cells was detected using the CCK-8 assay. (C, D) The ECAR and OCR of AGS and MKN-28 cells stably overexpressing miR-520a-3p or NC were measured using a Seahorse Bioscience XFp analyzer. (E–G) Glucose uptake, lactate production, and ATP synthesis were measured in AGS and MKN-28 cells stably overexpressing miR-520a-3p or NC. The data were normalized to protein concentrations. *P<0.05; **P<0.01; ***P<0.001.
Abbreviations: GC, gastric cancer; qRT-PCR, Quantitative real-time fluorescence PCR; CCK8, cell count kit-8; ECAR, extracellular acidification rate; OCR, cellular oxygen consumption rate; ATP, adenosine triphosphate.
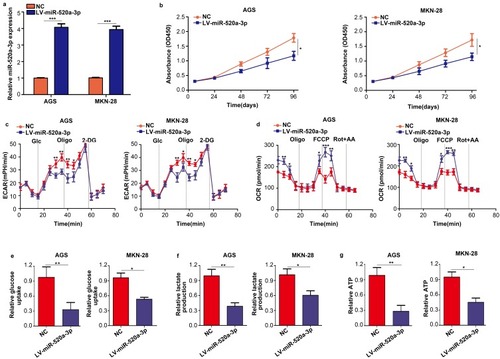
Figure 3 Inhibition of miR-520a-3p promoted the proliferation and glycolysis of GC cells in vitro. (A) qRT-PCR was used to detect the efficiency of the miR-520a-3p inhibitor and negative control. (B) The effect of miR-520a-3p inhibition on the proliferation of GC cells was detected using the CCK-8 assay. (C, D) The ECAR and OCR in AGS and MKN-28 cells treated with the miR-520a-3p inhibitor or NC were measured using a Seahorse Bioscience XFp analyzer. (E–G) Glucose uptake, lactate production, and ATP synthesis were measured in AGS and MKN-28 cells treated with the miR-520a-3p inhibitor or NC. The data were normalized to protein concentrations. *P<0.05; **P<0.01; ***P<0.001.
Abbreviations: GC, gastric cancer; qRT-PCR, Quantitative real-time fluorescence PCR; ECAR, extracellular acidification rate; OCR, cellular oxygen consumption rate; ATP, adenosine triphosphate.
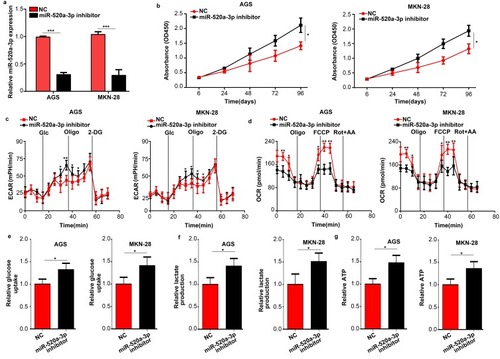
Figure 4 Overexpression of miR-520a-3p inhibited tumor growth in vivo. (A) Representative images of subcutaneous tumors of the miR-520a-3p overexpression group and control group. (B) The weight of tumor tissues in the miR-520a-3p overexpression group and control group. (C) AGS cells stably expressing miR-520a-3p or miR-NC were injected into the subcutaneous tissues of nude mice, and tumor growth was monitored for 5 weeks. (D) The weight of mice in the miR-520a-3p overexpression and miR-NC group was detected each week. (E) qRT-PCR assays showing the expression of miR-520a-3p in transplanted tumors in mice with specific number. (F) The expression of KI67 and PCNA in miR-520a-3p-overexpressing tumors and control tumors was detected through immunohistochemical staining (400×). *P<0.05; **P<0.01.
Abbreviations: qRT-PCR, Quantitative real-time fluorescence PCR; KI67, marker of proliferation Ki-67; PCNA, proliferating cell nuclear antigen.
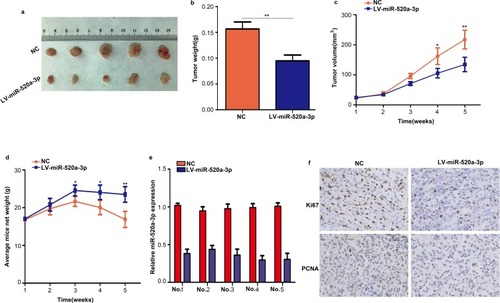
Figure 5 AKT1 is a vital target of miR-520a-3p in GC. (A) miR-520a-3p may bind to the 3ʹ-UTR of AKT1 mRNA. (B) miR-520a-3p mimics inhibited the luciferase activity in GC cells, while mutation of the associating element in 3′-UTR of AKT1 mRNA abolished the effect of the miR-520a-3p mimic on luciferase activity. (C) The expression of miR-520a-3p was inversely associated with that of AKT1 in GC tissues. (D) Western blotting was used to detect the expression of AKT1, mTOR, HIF1α, VEGF, and Glut1 in the miR-520a-3p-overexpressing group and control group. (E) The expression of AKT1, mTOR, HIF1α, VEGF, and Glut1 in miR-520a-3p high and low expression GC tissues (200× and 400×). *P<0.05.
Abbreviations: AKT1, AKT serine/threonine kinase 1; GC, gastric cancer; 3ʹ-UTR, 3ʹuntranslated region; mTOR, mechanistic target of rapamycin kinase; HIF1α, hypoxia inducible factor 1 subunit alpha; VEGF, vascular endothelial growth factor; Glut1, Glucose transporter 1; ECAR, extracellular acidification rate; OCR, cellular oxygen consumption rate; ATP, adenosine triphosphate.
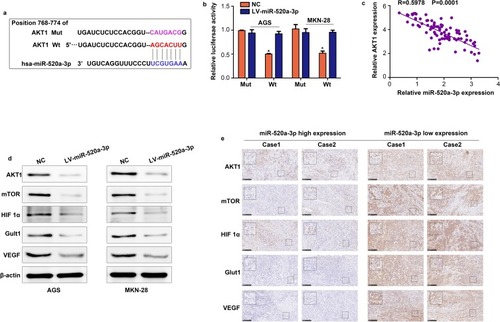
Figure 6 Restoration of AKT1 decreased the inhibitory effect of miR-520a-3p. According to the treatment factor, AGS and MKN-28 cells were divided into three groups: NC group, miR-520a-3p-overexpressing group, and miR-520a-3p plus AKT1-overexpressing group. (A) The expression of AKT1, mTOR, HIF1α, VEGF, and Glut1 was detected using Western blotting. (B) CCK8 assays were used to detect the proliferation ability of each group. (C, D) The ECAR and OCR of each group were measured using a Seahorse Bioscience XFp analyzer. (E–G) Glucose uptake, lactate production, and ATP synthesis were measured in each group. The data were normalized to protein concentrations. *P<0.05; **P<0.01; ***P<0.001.
Abbreviations: AKT1, AKT serine/threonine kinase 1; mTOR, mechanistic target of rapamycin kinase; HIF1α, hypoxia inducible factor 1 subunit alpha; VEGF, vascular endothelial growth factor; Glut1, Glucose transporter 1; CCK8, cell count kit-8; ECAR, extracellular acidification rate; OCR, cellular oxygen consumption rate; ATP, adenosine triphosphate.
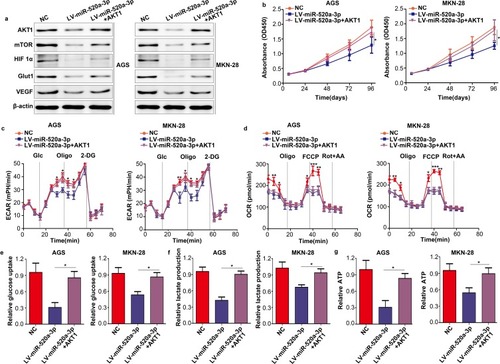
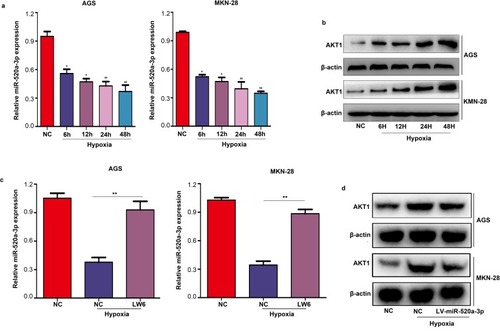
Figure 7 MiR-520a-3p/AKT1 was regulated by HIF1α under hypoxia. (A) qRT-PCR was used to detect the expression of miR-520-3p in AGS and MKN-28 cells under hypoxia. (B) Western blotting was used to detect the expression of AKT1 under hypoxia. (C) qRT-PCR were used to detect the expression of miR-520-3p in AGS and MKN-28 cells after treatment with LW6 (an inhibitor of HIF1α) under hypoxia. (D) Western blotting was used to detect the expression of AKT1 in the miR-520a-3p-overexpressing group under hypoxia. *P<0.05; **P<0.01.
Abbreviations: AKT1, AKT serine/threonine kinase 1; HIF1α, hypoxia inducible factor 1 subunit alpha; qRT-PCR, Quantitative real-time fluorescence PCR.