Figures & data
Figure 1 The effect of proton pump inhibitors on doxorubicin (DOX) delivery into monolayer-cultured cells at different pH values. (A) DOX fluorescence intensity in cells at different time periods at pH 7.4. (B) DOX fluorescence intensity in the cell nucleus at different time periods at pH 7.4. (C) DOX fluorescence intensity in cells at different time periods at pH 6.0. (D) DOX fluorescence intensity in the cell nucleus at different time periods at pH 6.0. (E) Representative images of cells after 4 hrs of incubation with DOX at pH 6.0. Magnification 600×. Scale bar = 50 µm. The asterisks (*) indicate p < 0.05.
Abbreviations: LANSO, lansoprazole; OME, omeprazole.
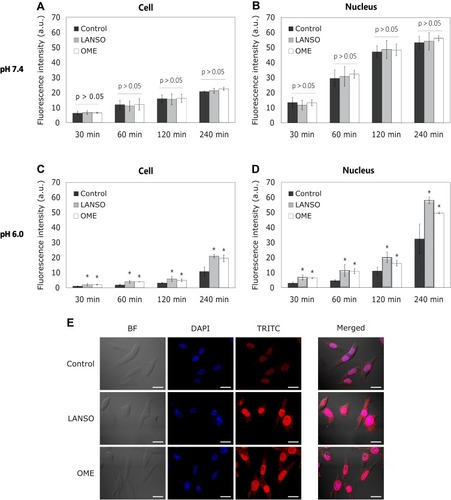
Figure 2 The effect of proton pump inhibitors on pegylated liposomal doxorubicin (PLD) delivery into monolayer-cultured cells at different pH values. (A) PLD fluorescence intensity in cells at different time periods at pH 7.4. (B) PLD fluorescence intensity in the cell nucleus at different time periods at pH 7.4. (C) PLD fluorescence intensity in cells at different time periods at pH 6.0. (D) DOX fluorescence intensity in the cell nucleus at different time periods at pH 6.0. (E) Representative images of cells after 4 hrs of incubation with DOX at pH 6.0. Magnification 600×. Scale bar = 50 µm. The asterisks (*) indicate p < 0.05.
Abbreviations: LANSO, lansoprazole; OME, omeprazole.
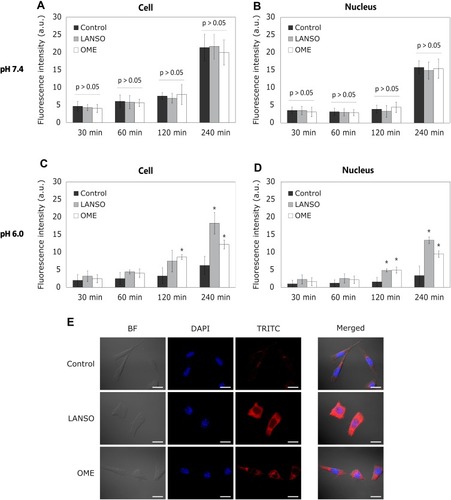
Figure 3 A schematic representing spheroid division into edge (0–50 µM from the spheroid edge), middle (100–150 µM) and center (200–225 µM) zones. The mean spheroid radius was 225 µM.
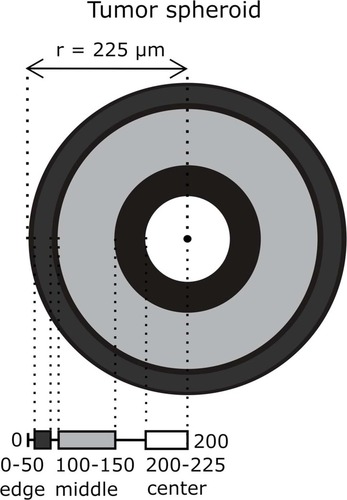
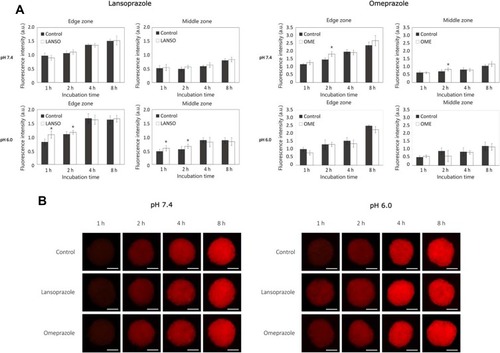
Figure 4 The effect of proton pump inhibitors on doxorubicin (DOX) delivery into tumor spheroids at different pH values. (A) Fluorescence intensity of DOX in spheroids affected with lansoprazole and omeprazole at pH 7.4 and 6.0. (B) Representative images of spheroids after different times of incubation with DOX at pH 7.4 and 6.0. Magnification 100×. Scale bar = 200 µm. The asterisks (*) indicate p < 0.05.
Abbreviations: LANSO, lansoprazole; OME, omeprazole.
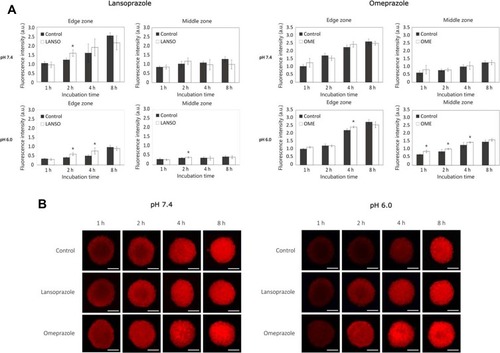
Figure 5 The effect of proton pump inhibitors on pegylated liposomal doxorubicin (PLD) delivery into tumor spheroids at different pH values. (A) Fluorescence intensity of PLD in spheroids affected by lansoprazole and omeprazole at pH 7.4 and 6.0. (B) Representative images of spheroids after different times of incubation with PLD at pH 7.4 and 6.0. Magnification 100×. Scale bar = 200 µm. The asterisks (*) indicate p < 0.05.
Abbreviations: LANSO, lansoprazole; OME, omeprazole.