Figures & data
Table 1 Sequences of PCR Primers for Target Gene Detection
Figure 1 The cytotoxicity and effects of Paeonol on PDACs. (A) The cytotoxicity of Paeonol at different concentrations (0, 6.25, 12.5, 25, 50, 100, 150, 300μM) and the cell viability at 24 hrs, 48 hrs and 72 hrs in Panc-1; (B) The cytotoxicity of Paeonol at various concentrations (0, 6.25, 12.5, 25, 50, 100, 150, 300μM) and cell viability for 24 hrs, 48 hrs and 72 hrs in Capan-1; (C) Paeonol (100 or 150μM) reduced clonogenic survival of Panc-1; (D) Compared to non-treated controls, Paeonol (100 or 150μM) suppressed colonial formation of Panc-1; (E) Paeonol (100 or 150μM) reduced clonogenic survival of Capan-1; (F) Compared to non-treated controls, Paeonol (100 or 150μM) suppressed colonial formation of Capan-1. Data were shown as mean ± SD of three independent experiments. **P<0.01.
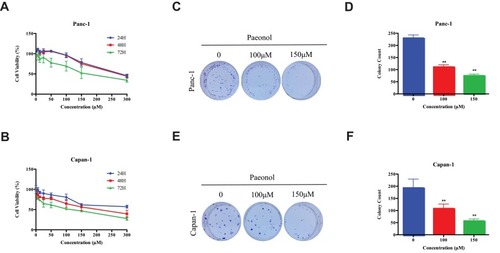
Figure 2 Paeonol suppresses the migration and invasion capacities of PDAC cells by promoting EMT. (A, B) Scratch wound-healing assay. Panc-1 and Capan-1 cells were treated with 100 or 150μΜ of Paeonol. The movement of cells into the wounds was shown at 0, 24 hrs, and 48 hrs after scratching (magnification: 100x); (C, D) Panc-1 and Capan-1 cells migration were assessed by restoring scratches and the reduction in the area of the initial scratches were compared. All results are representative of three independent experiments. **P<0.01, as compared Paeonol (100 or 150μΜ) with the non-treated control group; (E) Morphological changes in Panc-1 and Capan-1 cells after 48 hrs of culture with Paeonol (100 or 150μΜ). Arrows indicate cell shapes representing mesenchymal phenotypes; (F) The effect of Paeonol (100 or 150μΜ) treatment for 48 hrs on Panc-1 and Capan-1 cells was detected by chambers assays (magnification: 40x); (G) Histogram, based on five random fields selected for statistical analysis, shows the number of invaded cells. Data are shown as mean ± SD of three independent experiments. **P<0.01.
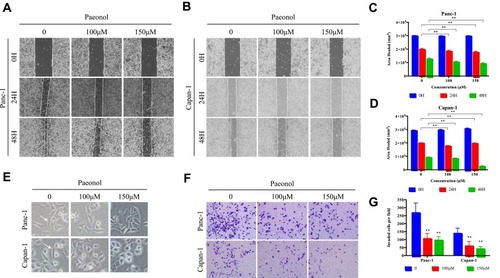
Figure 3 Paeonol reduces the mesenchymal characteristics and promotes epithelial characteristics of Panc-1 and Capan-1 cells and modulates the TGF-β1/Smad signaling. (A) Western blot analysis of protein levels of E-cadherin, N-cadherin, Vimentin, p-Smad2, Smad2, p-Smad3, Smad3 in Panc-1 and Capan-1 cells treated with either 100 or 150μΜ of Paeonol for 48 hrs; (B, C) Histograms show the change of relative protein expression of E-cadherin, N-cadherin, Vimentin in Panc-1 and Capan-1 cells; (D, E) Histograms show the change of relative protein expression of p-Smad2/Smad2, p-Smad3/Smad3 in Panc-1 and Capan-1 cells; (F–I) qRT-PCR analysis of mRNA levels of E-cadherin, N-cadherin, Vimentin and TGF-β1 in Panc-1 and Capan-1 cells treated with either 100 or 150μΜ of Paeonol for 48 hrs. Data are shown as mean ± SD of three independent experiments. *P < 0.05, **P < 0.01.
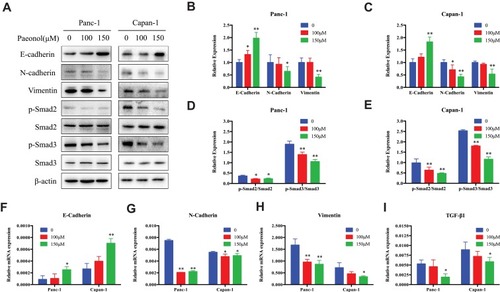
Figure 4 Paeonol attenuated the migration-promoting ability of TGF-β1. (A, B) Scratch wound-healing assay. Cell migration of Panc-1 and Capan-1 cells treated with or without Paeonol (100μΜ) and with or without TGF-β1 (10ng) for 48 hrs was assessed by restoring scratches and comparing with the area of the initial scratch (magnification: 100x); (C) The effects of Paeonol (100μΜ) treated with or without TGF-β1 (10ng) for 48 hrs on Panc-1 and Capan-1 cells migration were examined using chamber assays (magnification: 40x); (D, E) Histogram, based on five random fields of three independent experiments selected for statistical analysis, showed the number of invaded cells; (F, G) Histogram, based on Panc-1 and Capan-1 cell migrations were assessed by restoring scratches and the repair of the initial scratched area. All results are representative of three independent experiments. *P<0.05, **P<0.01, as compared with the non-treated control group.
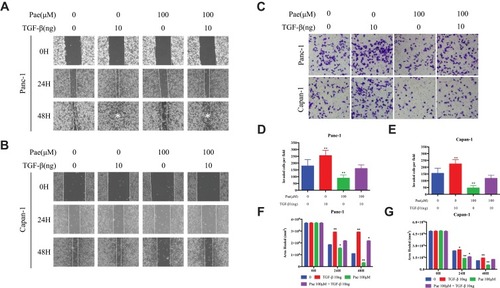
Figure 5 Paeonol attenuated mesenchymal characteristics promoting the effect of TGF-β1. (Α) Morphological changes of Panc-1 and Capan-1 cells after 48 hrs of treatment with or without Paeonol (100μΜ) and with or without TGF-β1 (10ng). Arrows indicate cell shapes representing mesenchymal phenotypes; (B, C) Western blot analysis of protein levels of E-cadherin, Vimentin in Panc-1 and Capan-1 cells treated with or without Paeonol (100μΜ) and with or without TGF-β1 (10ng) for 48 hrs; (D, E) Histograms show the change of relative protein expression of E-cadherin, Vimentin in Panc-1 and Capan-1 cells. Data are shown as mean ± SD of three independent experiments. *P < 0.05, **P < 0.01.
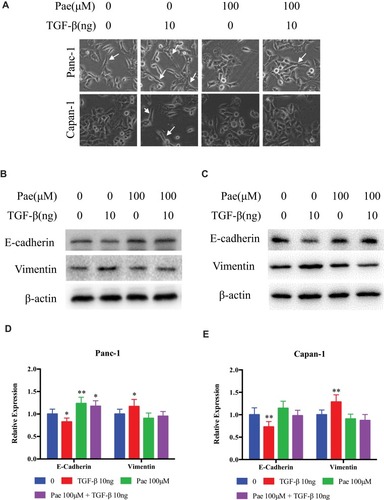
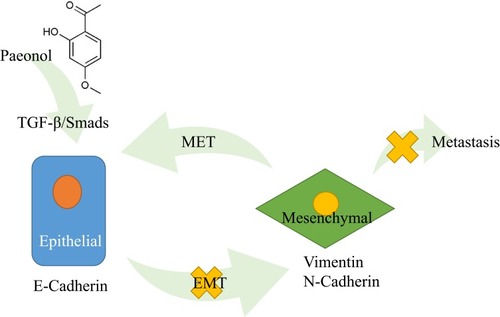
Figure 6 Schematic diagram of the molecular mechanisms of Paeonol’s the anti-migration and anti-invasion effects in PDAC. Paeonol could potentially inhibit migration and invasion of Panc-1 and Capan-1 cells by suppressing the activation of TGF-β1/SMAD signaling pathway and suppressing EMT in PDAC.