Figures & data
Figure 1 AOC1 is highly expressed in gastric cancer tissues compared with normal tissues. (A) The red and gray boxes indicate gastric cancer and normal tissues, respectively. Data were obtained from the GEPIA website, including 408 gastric cancer samples and 211 controls. The y-axis indicated the log2-transformed gene expression levels. qPCR (B) and western blot (C) were performed to detect AOC1 expression in the tumor and paracancerous tissues of 30 patients with gastric cancerthe. *P<0.05; **P<0.01; ***P<0.001.
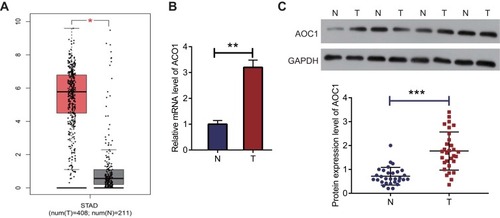
Figure 2 AOC1 expression is effectively knocked down by siRNA transfection in human gastric cancer cells. qRT-PCR assay was used to detect the interference efficiencies of siRNAs targeting AOC1 on mRNA levels in human (A) AGS and (B) MKN45 cells. (C) Western blot validated the effectiveness of AOC1 knockdown on protein levels. A scrambled siRNA was used as the negative control (NC). All experiments were performed in triplicate, independently. *P<0.05.
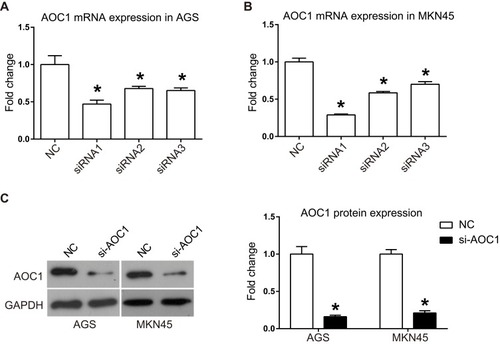
Figure 3 AOC1 knockdown induces growth inhibition in human gastric cancer cells. (A) and (B) After transfection with siNC or si-AOC1, the viability of AGS and MKN45 cells was detected by using CCK-8 assay. (C) and (D) Clone formation ability of AOC1 silenced gastric cancer cells was detected. All experiments were performed in triplicate. *P<0.05.
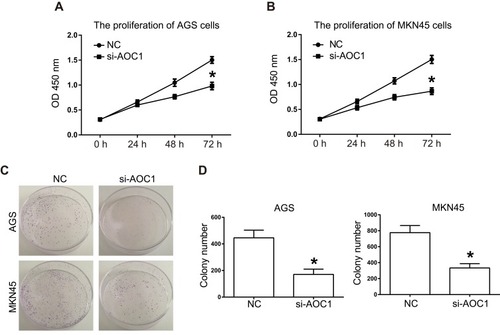
Figure 4 Knockdown of AOC1 inhibits cell invasion and migration in human gastric cancer cells. (A) and (C) Transwell assays detecting the invasion and migration of human AGS and MKN45 cells. (B) and (D) Invaded and migrated cells in si-AOC1 group or NC group were counted. All experiments were performed for three repeated times. *P<0.05.
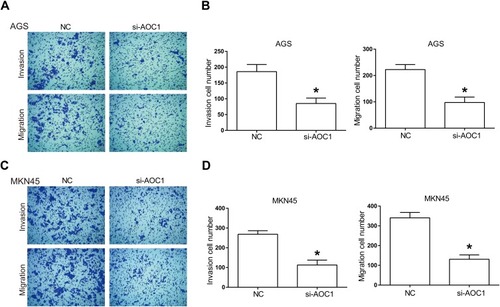
Figure 5 Knockdown of AOC1 induces apoptosis in human gastric cancer cells. (A) and (B) The effect of AOC1 knockdown on the apoptosis of AGS cells was detected using flow cytometry. (C) and (D) The effect of AOC1 knockdown on the apoptosis of MKN45 cells was detected using flow cytometry. All experiments were performed in triplicate. *P<0.05.
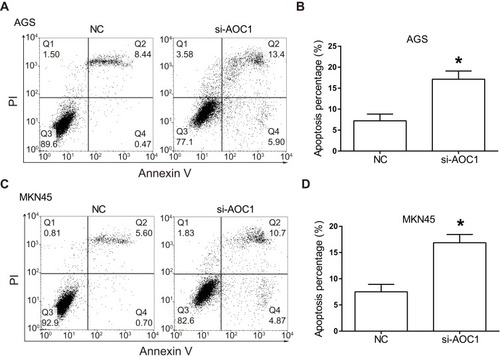
Figure 6 Knockdown of AOC1 induces activation of the mitochondrial apoptosis pathway, and also inhibits the AKT signaling pathway and EMT process. (A and B) The key members of the mitochondrial apoptosis pathway, including Bax, Bcl2, Caspase-9, and Caspase-3, were detected by Western blot. (C and D) AKT signaling pathway members, including AKT, p-AKT, Cyclin D1, and p70S6K, were detected by Western blot. (E and F) EMT-related proteins, including E-cadherin, N-cadherin, SNAIL and Slug, were detected by Western blot. All experiments were performed in triplicate. *P<0.05.
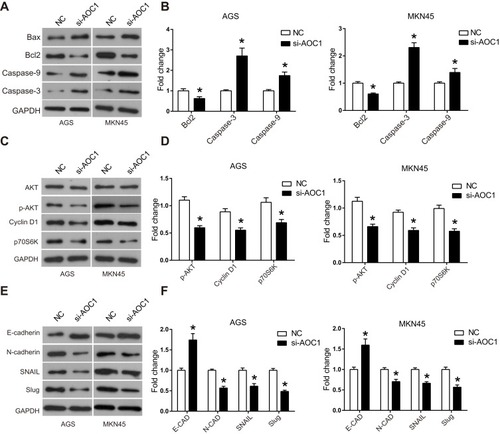
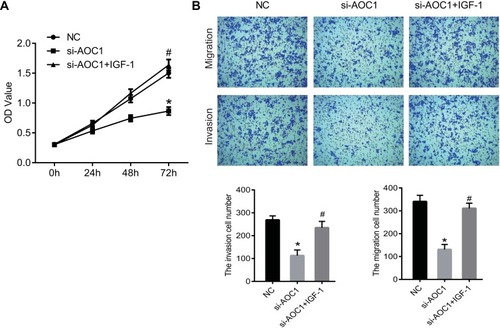
Figure 7 IGF-1 blocked the inhibition of cell proliferation, migration and invasion caused by AOC1 knockdown. AOC1 low expressing cells were treated with IGF-1, an agonist of the AKT pathway. (A) CCK8 was performed to detected the proliferation of each group cells. (B) Transwell was performed to detected the migration and invasion of each group cells. *P<0.05 vs. NC group; #P<0.05 vs. si-AOC1 group.