Figures & data
Table 1 Univariate Analysis of Risk Factors for CNS Involvement
Table 2 Multivariate Analysis of Risk Factors for CNS Involvement
Table 3 Baseline Characteristics of 38 DLBCL Patients with CNS Involvement
Table 4 Univariate Analysis of 38 DLBCL Patients with CNS Involvement
Table 5 Multivariate Analysis of 38 DLBCL Patients with CNS Involvement
Figure 1 Kaplan–Meier curve of the median OS durations of 38 DLBCL patients after CNS involvement.
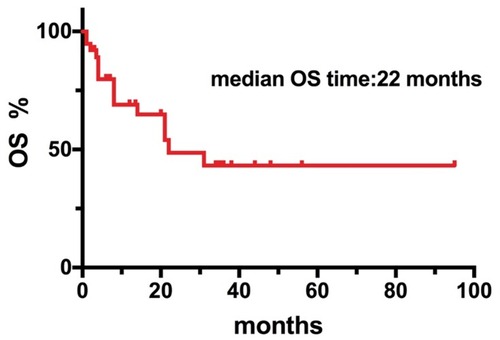
Figure 2 Kaplan–Meier curve of the median PFS durations of 38 DLBCL patients after CNS involvement.
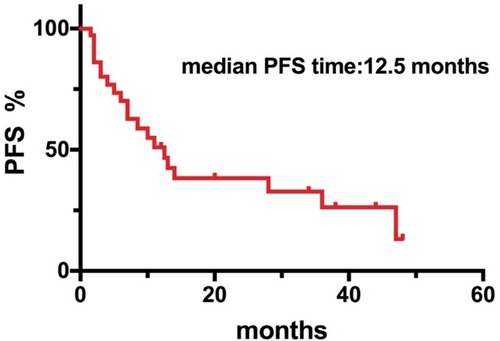
Figure 3 Kaplan–Meier curve of OS time between 38 DLBCL patients with CNS involvement (SCNSL) and 100 DLBCL patients without CNS involvement.
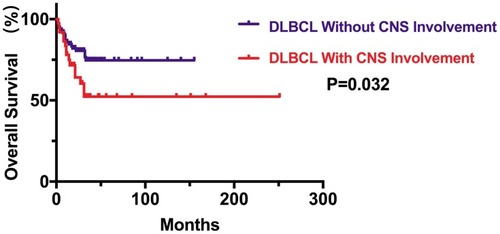
Figure 4 Kaplan–Meier curve of OS time between 11 DLBCL patients with CNS involvement only and 27 DLBCL patients with extra-CNS involvement.
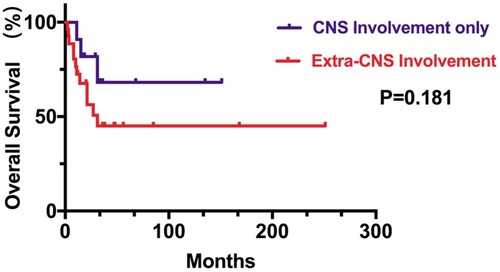
Figure 5 Kaplan–Meier curve of OS time between the 15 patients with CNS involvement at the time of DLBCL diagnosed and 23 patients with CNS involvement during or after first-line therapy.
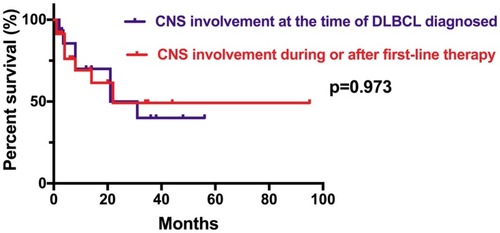
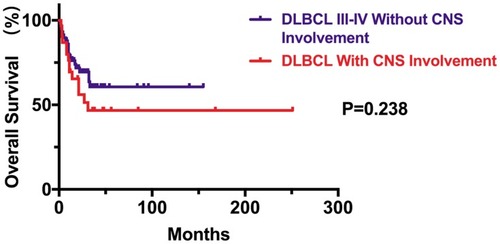
Figure 6 Kaplan–Meier curve of OS time between the 38 patients with CNS involvement and 40 stage III-IV DLBCL cases without CNS involvement.