Figures & data
Table 1 The Primers Of Genes For RT-qPCR
Figure 1 RT-qPCR results showed that miR-122-5p is upregulated in renal cancer cells compared to HK2 cells (**p<0.01).
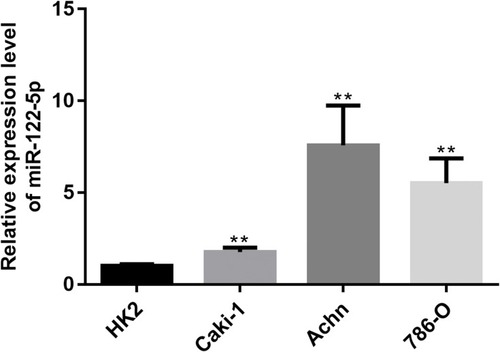
Figure 2 Altered energy metabolism in renal cancer cells. (A) RT-qPCR results showed the relative mRNA expression levels of PI3K, AKT3, mTOR and PKM2 in renal cancer cells. (B, C) The glucose consumption and lactate production in renal cancer cells (*p<0.05; **p<0.01; ***p<0.001; ****p<0.0001).
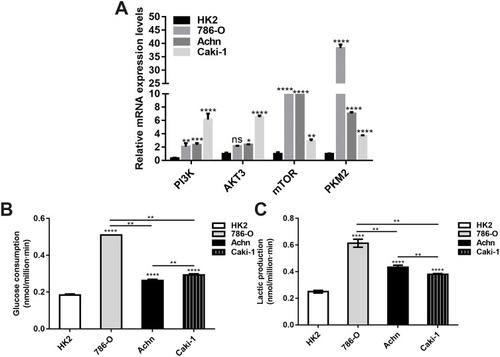
Figure 3 MiR-122-5p could inhibit PKM2 expression in 786-O cells. (A) RT-qPCR results showed that the mRNA expression of miR-122-5p in 786-O cells transfected by miR-122-5p inhibitor was obviously lower than of control group. (B, C) Western blot analysis results showed that the protein expression of PKM2 in 786-O cells transfected by miR-122-5p inhibitor was significantly higher than of control group. (D, E) The protein expression of PKM2 in 786-O cells transfected by siPKM2 was significantly lower than control group using Western blot analysis (*p<0.05; **p<0.01; ***p<0.001).
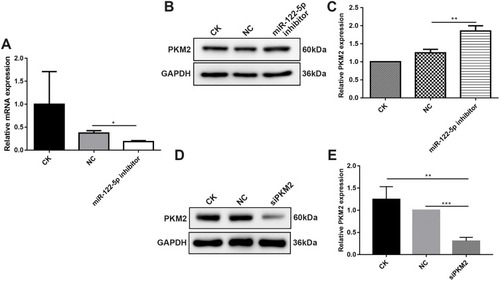
Figure 4 Knockdown of miR-122-5p or PKM2 suppresses renal cancer cell viability using CCK-8 assay (****p<0.0001).
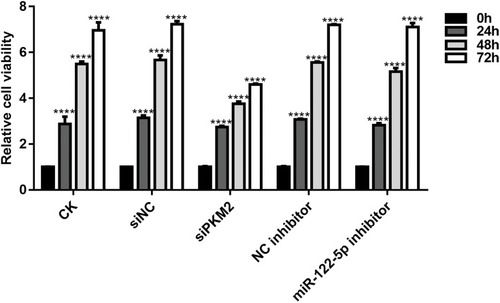
Figure 5 Knockdown of miR-122-5p or PKM2 affects cell cycle progression of renal cancer cells. (A, B) The cell cycle of 786-O cells was detected with flow cytometry assay (****p<0.0001).
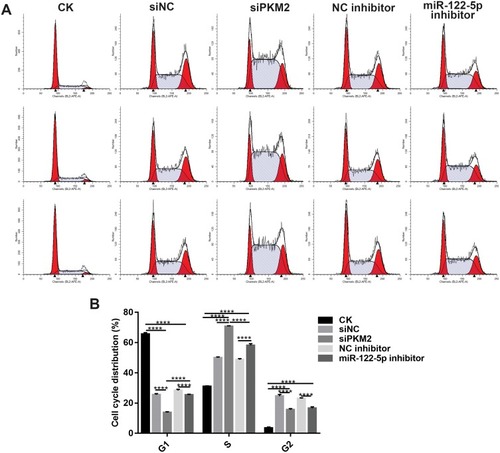
Figure 6 Knockdown of miR-122-5p or PKM2 promotes renal cancer cell apoptosis. (A and B): The apoptosis of 786-O cells was detected with flow cytometry assay (*p<0.05; ***p<0.001; ****p<0.0001).
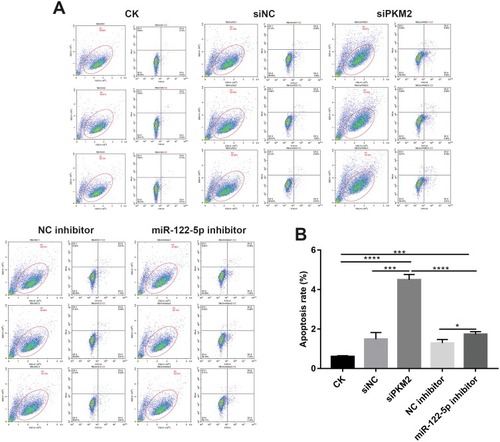
Figure 7 Knockdown of miR-122-5p or PKM2 inhibits renal cancer cell migration. (A and B) The migration ability was detected in 786-O cells transfected miR-122-5p inhibitor or siPKM2 for 24 hrs (**p<0.01; ***p<0.001; ****p<0.0001).
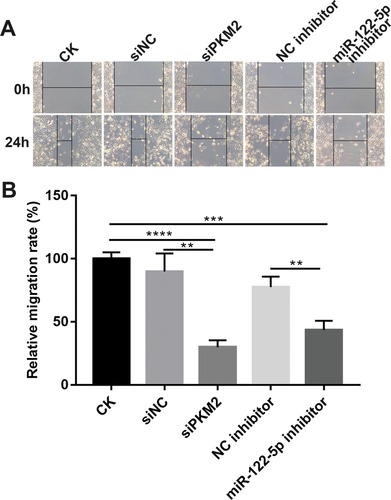
Figure 8 Inhibiting miR-122-5p promotes glycolysis of renal cancer cells by PKM2. (A) The glucose consumption of 786-O cells transfected by siPKM2 or miR-122-5p inhibitor. (B) The lactate production of 786-O cells transfected by siPKM2 or miR-122-5p inhibitor. (C, D) Western blot analysis results showed that the expression of PDH was significantly increased in 786-O cells transfected by miR-122-5p inhibitor (*p<0.05; **p<0.01; ***p<0.001).
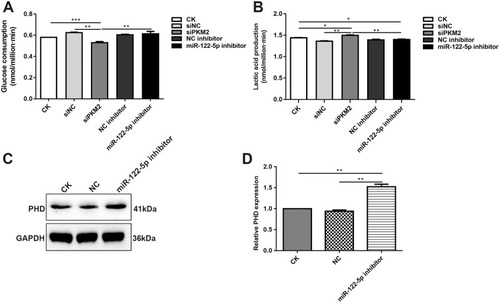
Figure 9 MiR-122-5p could be involved in autophagy of renal cancer cells. (A, B) Western blot analysis results showed the expression levels of LC3II/I in 786-O cells treated with miR-122-5p inhibitor (**p<0.01; ***p<0.01).
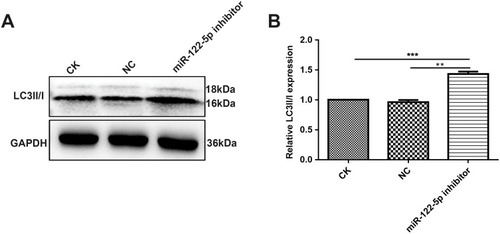
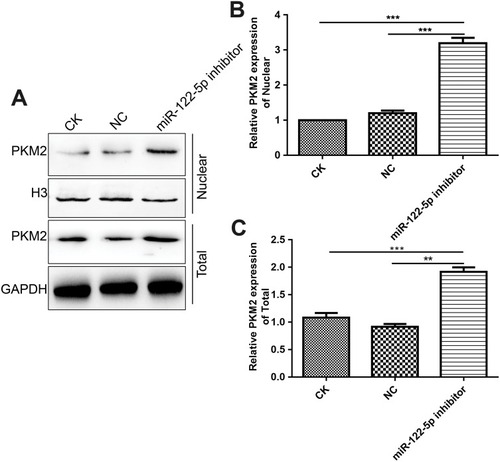
Figure 10 Inhibiting miR-122-5p promotes PKM2 nuclear translocation in 786-O cells. (A–C): The nuclear location of PKM2 in 786-O cells under miR-122-5p inhibitor treatment (**p<0.01; ***p<0.01).