Figures & data
Figure 1 The main framework to construct the gene pathways dependency network. (A) Steps in identifying the genes regulated by ALA-PDT. (B) The 46 regulators most highly ranked based on their p-value in the microarray are depicted. (C) The KEGG database were used to analyze pathways associated with the inflammatory after ALA-PDT. 133 pathways at 3 hrs(red cycle) after PDT and 140 pathways at 6 hrs (green cycle) identified. Then built the pathway interaction based on the KEGG database on the website and identified the eight signaling pathways (http://www.gcbi.com.cn). (D) Gene expression fold changes of two target genes IL1R1 and IL1β as determined by microarray and real-time q-PCR experiments. The direction and magnitude of fold changes obtained from the real-time q-PCR technique were comparable to those obtained from the microarray technique. P < 0.05 for gene expression fold changes quantified by real-time PCR experiments as determined by two-tailed unpaired Student’s t-test. (E–G) IL1β expression was increased 3hrs after ALA-PDT especially in fibroblasts (Vimentin positive cells).
Notes: Data were presented as mean ± SEM. *p<0.05; **p<0.01; ***p<0.001.
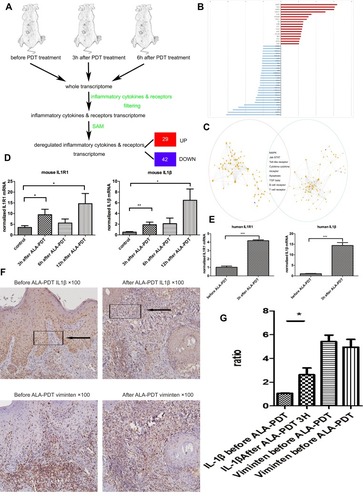
Figure 2 (A, B) Accelerated solid tumor growth in anti-IL1β-antibody-group and caspase1-inhibitor-group(casp−/− ). Growth curve of SCC tumor (A, n=10; B, n=10) tumors in SKH-1 mice after ALA-PDT.
Note: ***p<0.001.
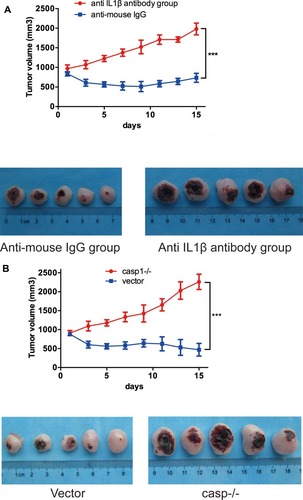
Figure 3 (A) Surface markers of mCAFs including vimentin, α-SMA and FAP positive. (B) CAFs and NIH/3T3 secreted more IL1β than HDF through IHC. Tumor cells including A431 (C, D), PECA (E, F) and cSCC (G, H) expressed more IL1β after ALA-PDT with time, however, the changes have no statistical significance. Fibroblasts including HDF (C, D) and NIH/3T3 (E, F) expressed more IL1β 48hrs after ALA-PDT, but the difference has not statistical significance. mCAFs expressed more IL1β with time and secreted more IL1β 6hrs, 24hrs and 48hrs after ALA-PDT.
Notes: **p<0.01; ***p<0.001.
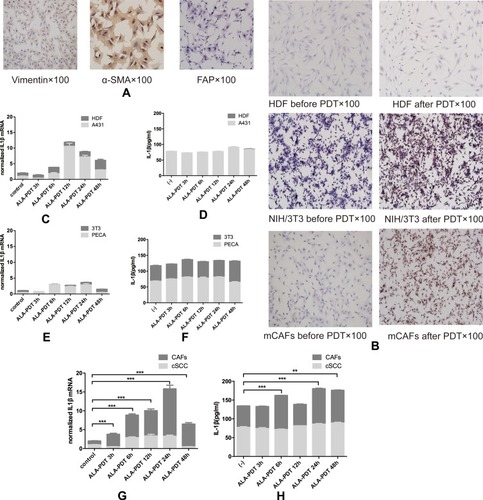
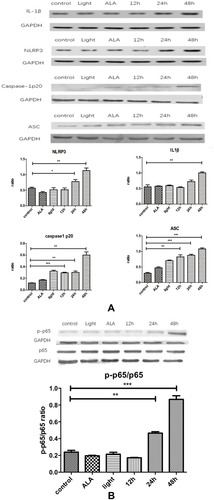
Figure 4 Production of IL1β occurs through activating NLRP3 inflammasome in an NF-κB-dependent manner. (A) Compared with the control, IL1β, NLRP3, caspase-1p20 and ASC all showed increased expression with time, esp in the 48hrs. (B) p-p65/p65 ratio increases with time. Control: CAFs were incubated with DMEM and without exposed to the light; Light: CAFs were incubated with DMEM for 5hrs at 37°C and exposed to the light; ALA: CAFs were incubated with ALA (0.5 mM) for 5h at 37°C, but not exposed to the light;12hrs/24hrs/48hrs: CAFs were incubated with ALA (0.5 mM) and exposed to the light. We collected the cell samples in 12hrs/24hrs/48hrs.
Notes: *p<0.05; **p<0.01; ***p<0.001.