Figures & data
Figure 1 Effect of TMPO-AS1 overexpression on C-33A cell proliferation, migration, and invasion. (A) TMPO-AS1 expression in cervical cancer cell lines (HeLa, SiHa, CaSki, C-33A) and HPV–immortalized cervical epithelial cell line (H8) was examined by qRT-PCR. (B) The overexpression efficiency of TMPO-AS1 in C-33A cells was confirmed by qRT-PCR. (C–E) Cell viability (C), migration (D), and invasion (E) in C-33A cells transfected with pcDNA3.1-TMPO-AS1 or empty vector were evaluated using CCK-8 assay and transwell migration and invasion assay, respectively. Scale bar: 50 μm. **P<0.01 vs H8 or vector. N=3.
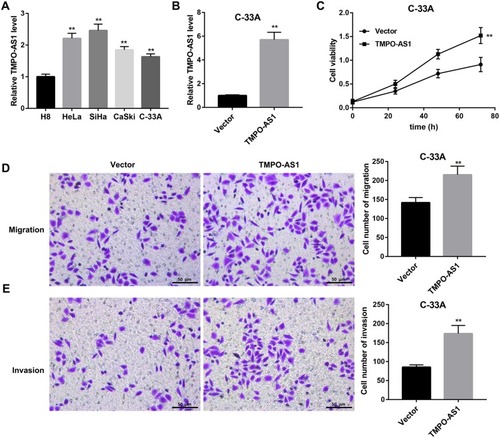
Figure 2 Effect of TMPO-AS1 silencing on SiHa cell proliferation, migration, and invasion. (A) The knockdown efficiency of TMPO-AS1 in SiHa cells was confirmed by qRT-PCR. Cell viability (B), migration (C), and invasion (D) in SiHa cells transfected with si-TMPO-AS1 or si-Ctrl were evaluated using CCK-8 assay and transwell migration and invasion assay, respectively. Scale bar: 50 μm. **P<0.01 vs si-Ctrl. N=3.
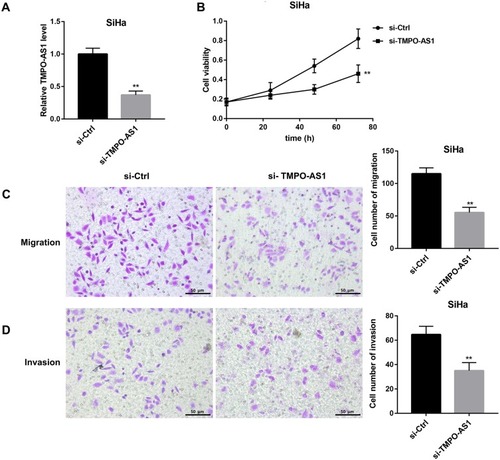
Figure 3 Effect of TMPO-AS1 overexpression and knockdown on the expression of miR-143-3p and ZEB1. (A) Diagrammatic sketch of the binding site for TMPO-AS1 and miR-143-3p. Dual-luciferase report assay indicated a decline in luciferase activity of TMPO-AS1 WT reporter upon introduction of miR-143-3p mimic. **P<0.01 vs the mimic NC+ TMPO-AS1 WT group. (B) Diagrammatic sketch of the binding site for miR-143-3p and ZEB1 3ʹ-UTR. Dual-luciferase report assay suggested a decline in luciferase activity of ZEB1 WT reporter upon introduction of miR-143-3p mimic. **P<0.01 vs the mimic NC+ ZEB1 WT group. qRT-PCR analysis of miR-143-3p expression (C), ZEB1 mRNA level (D), and Western blot analysis of ZEB1 protein level (E) in C-33A cells transfected with pcDNA3.1-TMPO-AS1 and empty vector. **P<0.01 vs vector. qRT-PCR analysis of miR-143-3p expression (F), ZEB1 mRNA level (G), and Western blot analysis of ZEB1 protein level (H) in SiHa cells transfected with si-TMPO-AS1 and si-Ctrl. **P<0.01 vs si-Ctrl. N=3.
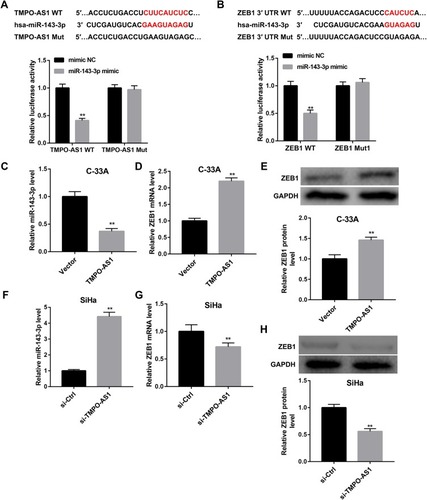
Figure 4 Effect of TMPO-AS1 overexpression and knockdown on the miR-143-3p regulation of ZEB1 expression. qRT-PCR analysis of ZEB1 mRNA level (A) and Western blot analysis of ZEB1 protein level (B) in C-33A cells co-transfected with pcDNA3.1-TMPO-AS1/empty vector and miR-143-3p mimic/mimic NC. **P<0.01, vs mimic NC+vector; #P<0.05, ##P<0.01, vs mimic NC+ TMPO-AS1 or vector+ miR-143-3p mimic. qRT-PCR analysis of ZEB1 mRNA level (C) and Western blot analysis of ZEB1 protein level (D) in SiHa cells co-transfected with si-TMPO-AS1/si-Ctrl and miR-143-3p inhibitor/inhibitor NC. *P<0.05, **P<0.01, vs inhibitor NC+si-Ctrl; ##P<0.01, vs inhibitor NC+ si-TMPO-AS1 or si-Ctrl+ miR-143-3p inhibitor. N=3.
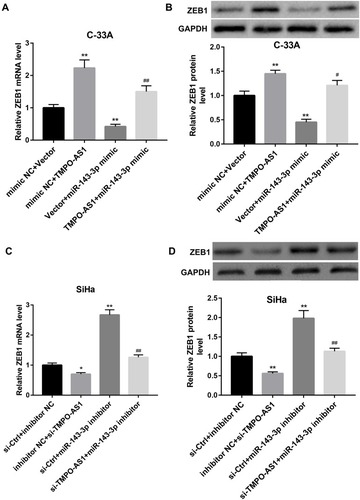
Figure 5 Effect of miR-143-3p mimic on TMPO-AS1 overexpression-mediated promotion of C-33A cell proliferation, migration, and invasion. C-33A cells were co-transfected with pcDNA3.1-TMPO-AS1/empty vector and miR-143-3p mimic/mimic NC. Cell viability (A), migration (B), and invasion (C) were evaluated using CCK-8 assay and Transwell migration and invasion assay, respectively. Scale bar: 50 μm. *P<0.05, **P<0.01, vs mimic NC+vector; #P<0.05, ##P<0.01, vs mimic NC+ TMPO-AS1 or vector+ miR-143-3p mimic. N=3.
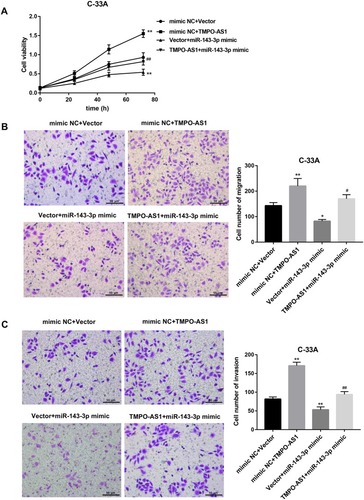
Figure 6 Effect of ZEB1 silencing on TMPO-AS1 overexpression-mediated promotion of C-33A cell proliferation, migration, and invasion. C-33A cells were co-transfected with pcDNA3.1-TMPO-AS1/empty vector and si-ZEB1/si-Ctrl. Cell viability (A), migration (B), and invasion (C) were evaluated using CCK-8 assay and Transwell migration and invasion assay, respectively. Scale bar: 50 μm. **P<0.01, vs vector+si-Ctrl; ##P<0.01, vs si-Ctrl+ TMPO-AS1 or vector+ si-ZEB1. N=3.
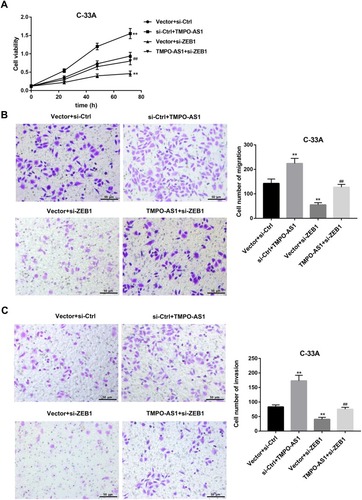
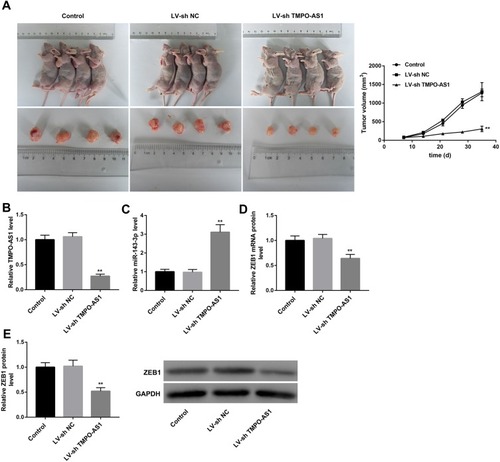
Figure 7 TMPO-AS1 knockdown inhibited cervical cancer cell tumorigenesis in vivo. (A) Images of representative tumors excised from mice and tumor growth curve reflected by tumor volume. (B) TMPO-AS1 expression, (C) miR-143-3p expression, and (D) ZEB1 mRNA expression in tumors were examined by qRT-PCR. (E) ZEB1 protein level in tumors was determined by Western blot. **P<0.01, vs LV-sh NC. N=4.