Figures & data
Table 1 The Primers and siRNA Sequences Used in This Study
Figure 1 Knockdown of BCYRN1 inhibits the proliferation and metastasis of glioma. (A) Decreased BCYRN1 levels in U87 and U251 cells transfected with si-BCYRN1, using si-NC as a negative control. The data are presented as the mean±SD (n=3 in each group). ***p<0.001 vs the si-NC group. (B) BCYRN1 knockdown significantly inhibited the proliferative capability of U87 and U251 cells as determined by MTS assays (*p<0.05, **p<0.01, ***p<0.001). (C and D) Transwell assay results for U87 and U251 cells transfected with si-BCYRN1 and si-NC. Representative images and the accompanying statistical plots are presented. The data are presented as the mean±SD (n=3 in each group). *p<0.05, **p<0.01 vs the si-NC group. (E) The wound-healing assay showed the migratory abilities of U87 and U251 cells transfected with si-BCYRN1 and si-NC. Wound closure was measured at 0 h and 24 h. Representative images and the accompanying statistical plots are presented. The data are presented as the mean±SD (n=3 in each group). **p<0.01 vs the si-NC group.
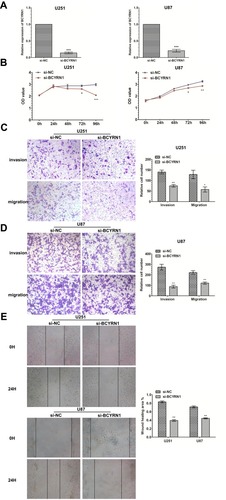
Figure 2 Overexpression of BCYRN1 promotes the proliferation and metastasis of glioma. (A) We used qRT-PCR to measure the expression levels of BCYRN1 in U87 and U251 cells transfected with p-BCYRN1, using p-MSCV as a negative control. The data are presented as the mean±SD (n=3 in each group). **p<0.01 vs the p-MSCV group. (B and C) Overexpression of BCYRN1 significantly increased the proliferative capability of U87 and U251 cells as determined by MTS assays (*p<0.05). (D and E) Transwell assay results for U87 and U251 cells transfected with p-BCYRN1 and p-MSCV. Representative images and the accompanying statistical plots are presented. The data are presented as the mean±SD (n=3 in each group). **p<0.01, ***p<0.001 vs the p-MSCV group.
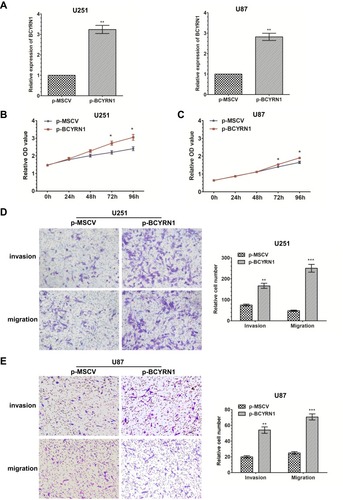
Figure 3 BCYRN1 binds to miR-125a-5p and negatively regulates its expression. (A) LncBase Predict V.2 predicted a binding site for BCYRN1 on miR-125a-5p. (B and C) qRT-PCR was used to measure the expression levels of miR-125a-5p in U251 cells transfected with p-BCYRN1 and si-BCYRN1. The results indicated that miR-125a-5p expression was upregulated by BCYRN1 knockdown, and miR-125a-5p expression was downregulated by BCYRN1 overexpression. The data are presented as the mean±SD (n=3 in each group). *p<0.05, **p<0.01 vs the negative control group. (D and E) The expression of BCYRN1 as determined by qRT-PCR in U251 cells transfected with an miR-125a-5p inhibitor and miR-125a-5p mimic. The data are presented as the mean±SD (n=3 in each group). *p<0.05, **p<0.01 vs the negative control group.
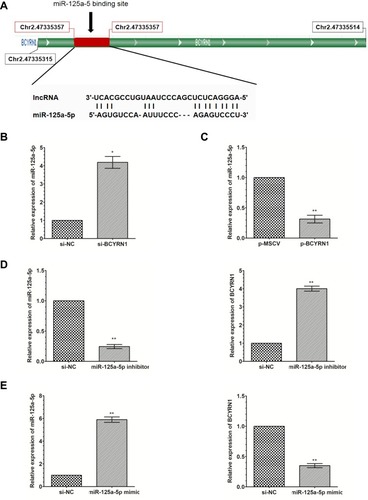
Figure 4 BCYRN1 modulates the expression of the endogenous miR-125a-5p target TAZ. Western blotting was conducted to detect the protein expression of TAZ, while qRT-PCR was performed to detect the mRNA expression of TAZ, after U251 cells were transfected with p-BCYRN1 and p-MSCV. The results showed that BCYRN1 overexpression significantly increased both the mRNA (A) and protein (B) levels of TAZ. (C and D) BCYRN1 knockdown substantially decreased both the mRNA and protein expression of TAZ in U251 cells. (E) The protein levels of TAZ in U251 cells transfected with si-NC, si-BCYRN1, or si-BCYRN1+miR-125a-5p inhibitor were determined by Western blotting. The results indicated that BCYRN1 knockdown suppressed the protein expression level of TAZ, which could be reversed by inhibiting the expression of miR-125a-5p. *p<0.05 vs the negative control group.
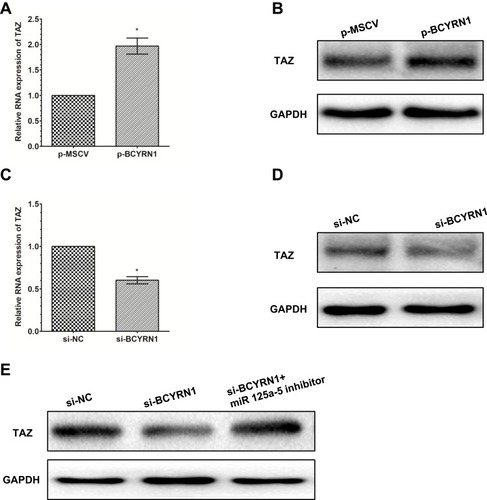
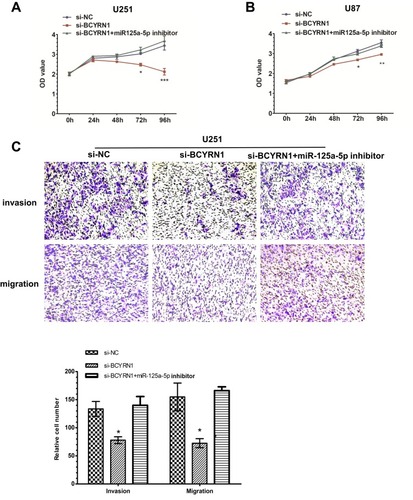
Figure 5 A miR-125a-5p inhibitor restores BCYRN1 siRNA function. (A and B) U251 and U87 cells were transfected with si-NC, si-BCYRN1, or si-BCYRN1+miR-125a-5p inhibitor. MTS assays were performed to assess cell proliferation. The results showed that downregulation of BCYRN1 inhibited cell proliferation, while the miR-125a-5p inhibitor reversed the inhibitory effects of BCYRN1. The data are presented as the mean±SD (n=3 in each group).*p<0.05, **p<0.01 and ***p<0.001 vs the si-NC group. (C) Transwell assays were used to measure the invasion and migration of U251 cells. We found that downregulation of BCYRN1 significantly suppressed cell invasion and migration, but these effects were reversed by inhibition of miR-125a-5p. Representative images and the accompanying statistical plots are presented. The data are presented as the mean±SD (n=3 in each group). *p<0.05 vs the si-NC group.