Figures & data
Table 1 Patients’ Baseline Characteristics
Table 2 Univariate Analysis And Multivariate Analysis For Overall Survival
Table 3 Multivariate Analysis For Overall Survival Including IPSI
Figure 1 Survival curve according to IPSI in all patients.
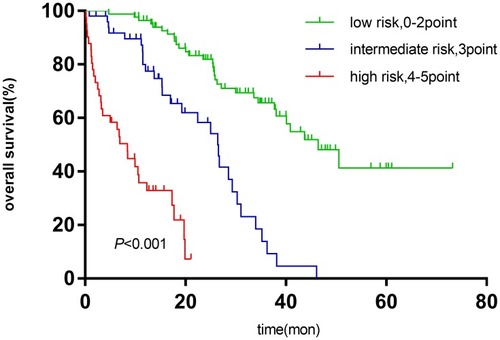
Figure 2 (A) Survival curve of IPSI in patients with ISS I. (B) Survival curve of IPSI in patients with ISS II. (C) Survival curve of IPSI in patients with ISS III.
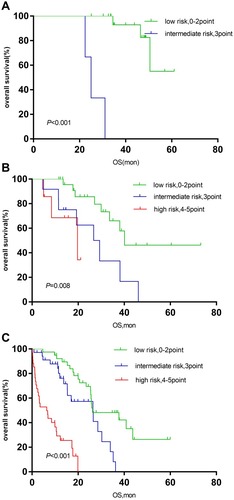
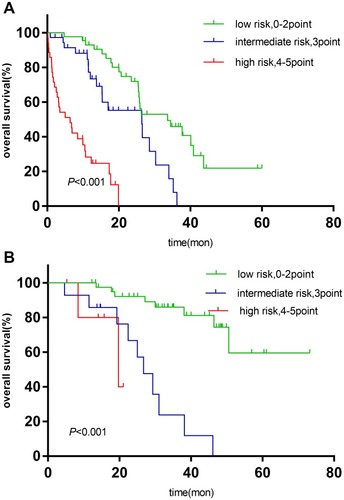
Figure 3 (A) Survival curve of IPSI in patients with young age (age≤65 years). (B) Survival curve of IPSI in patients with old age (age>65 years).
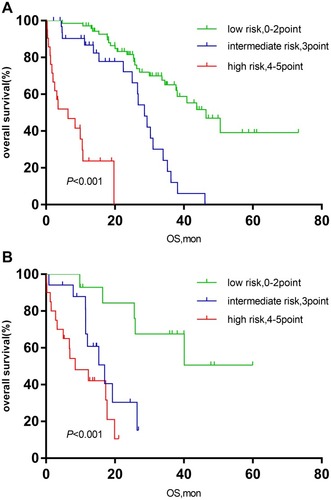
Figure 4 (A) Survival curve of IPSI in patients with normal renal function (serum creatinine ≤117μmol/L). (B) Survival curve of IPSI in patients with Abnormal renal function (serum creatinine >117μmol/L).
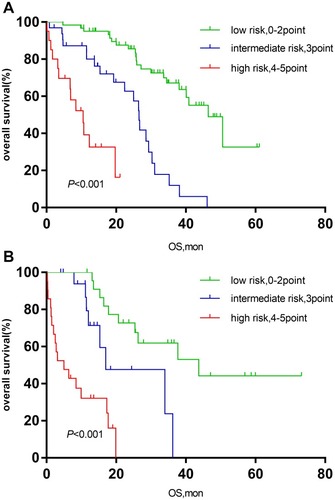
Figure 5 (A) Survival curve of IPSI in patients with low serum calcium (calcium ≤2.65mmol/L). (B) Survival curve of IPSI in patients with high serum calcium (calcium>2.65mmol/L).
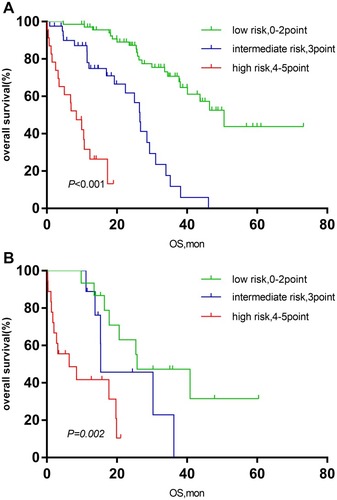
Figure 6 (A) Survival curve of IPSI in patients with bortezomib-based maintenance therapy. (B) Survival curve of IPSI in patients with immunomodulator-based maintenance therapy.