
Figures & data
Table 1 Clinicopathological Characteristics Of 266 Patients With Thoracic Esophageal Squamous Cell Carcinoma
Table 2 Univariate And Multivariate Logistic Regression Analysis Between Tumor Response And Inflammation-Based Markers And Clinicopathological Characteristics In Patients With Thoracic ESCC (n=266)
Figure 1 Kaplan–Meier curves for OS stratified according to NLR, PLR, and CRP/ALB ratio median values.
Notes: (A) OS curves grouped by NLR median value (the 3-year OS for low NLR 48.1%, high NLR 20.8%, P=0.001). (B) OS curves stratified according to PLR median value (the 3-year OS for low PLR 44.4%, high PLR 24.5%, p=0.027). (C) OS curves stratified by CRP/ALB ratio median value (the 3-year OS for low CRP/ALB ratio 61.5%, high CRP/ALB ratio 9.1%, P=0.000).
Abbreviations: OS, overall survival; NLR, neutrophil to lymphocyte ratio; PLR, platelet lymphocyte ratio; CRP/Alb, C-reactive protein/albumin.
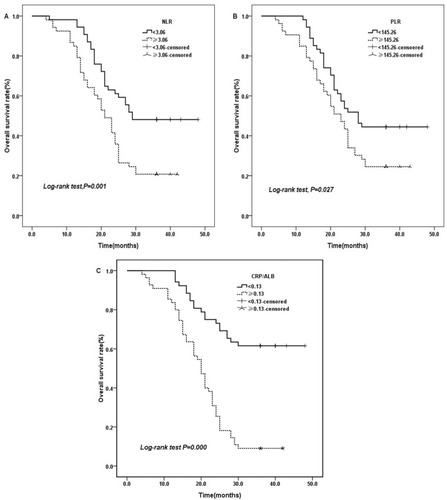
Table 3 Univariate And Multivariate Analysis Of Clinicopathological Parameters And Hematological Markers For The Prediction Of Overall Survival In Patients With Thoracic ESCC (N =266)
Figure 2 The ROC curves grouped by NLR, PLR and CRP/ALB ratio.
Notes: (A) ROC curves based on therapeutic effect. (B) ROC curves for OS.
Abbreviations: AUC, area under the curve; NLR, neutrophil lymphocyte ratio; PLR, platelet lymphocyte ratio; CRP/Alb, C-reactive protein/albumin; ROC, receiver operating characteristic.
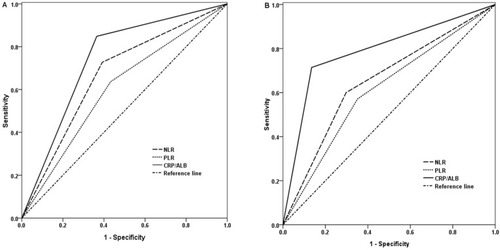
Figure 3 Prediction Nomogram for therapeutic efficacy.
Notes: (A) Therapeutic evaluation of nomogram-integrated CRP/Alb ratio in the patients with esophageal squamous cell cancer receiving CRT RT only. (B) The calibration curve of the nomogram for the tumor response. (C) The decision curve analysis of the nomogram for the tumor response.
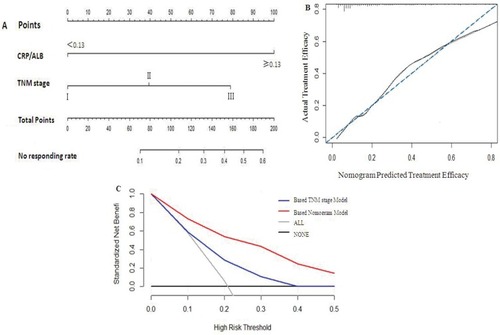
Figure 4 Prediction nomogram for overall survival.
Notes: (A) Survival evaluation of nomogram-integrated CRP/Alb ratio in the patients with esophageal squamous cell cancer receiving CRT RT only. (B) The calibration plot for the probability of survival at 3-year after treatment. (C) The decision curve analysis of the nomogram for the 3-year survival rate.
