Figures & data
Table 1 Clinical Features Of Enrolled Patients
Figure 1 Analysis of meningioma patients using 18F-FDG PET from the database.
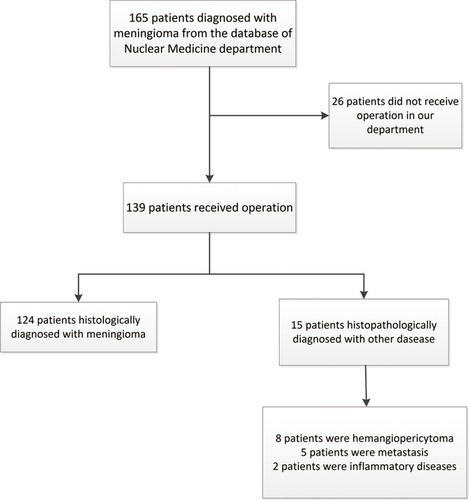
Table 2 Comparison Of Characteristics Of Patients By Different WHO Grades (Grade I Vs Grade II Vs Grade III)
Figure 2 Scatter plot showing the association between the TGR on FDG PET and the tumor proliferative behavior (Ki-67 labeling index).
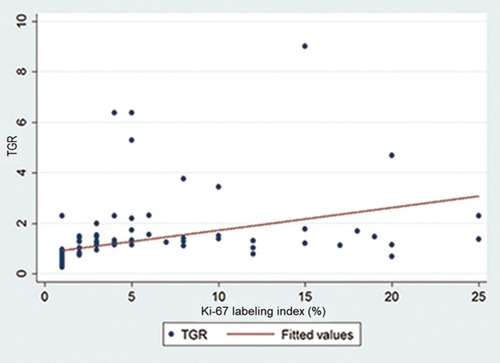
Figure 3 ROC curve of the TGR of meningioma. AUC of the TGR between low grade (WHO grade I) and high grade (WHO grade II&III) was 0.8533. The optimal cut-off value was 1.30. The sensitivity and specificity were 69.23% and 91.84%, respectively.
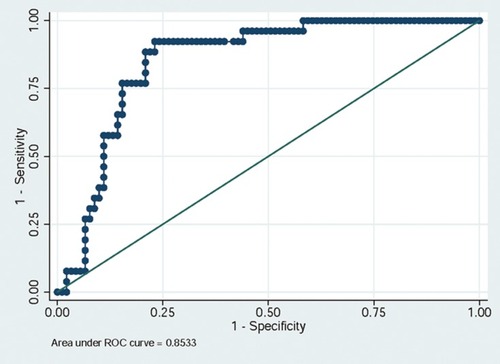
Table 3 Univariate And Multivariate Analysis Of Prognostic Factors In Patients With Meningioma In Our Series
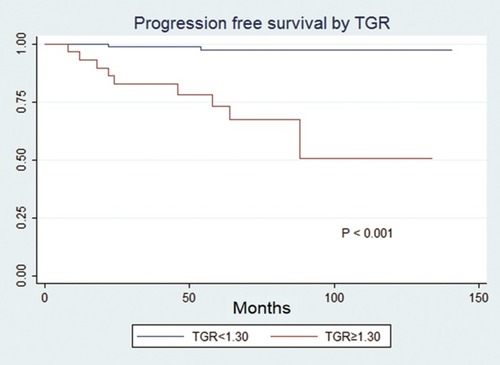
Figure 4 Kaplan-Meier survival curve. Progression-free survival of patients by TGR (<1.30 vs ≥1.30).