Figures & data
Table 1 Clinicopathological Characteristics of Training and Validation Data Sets
Figure 1 CI score. Distance y (blue line) between middle axial plane and plane of maximum tumor diameter is calculated by multiplying the number of sections by thickness of the section. Distance x (green line) is measured from the central 90-degree axial reference point to the tumor center. Distance c (red line) is calculated and divided by tumor radius to determine CI.
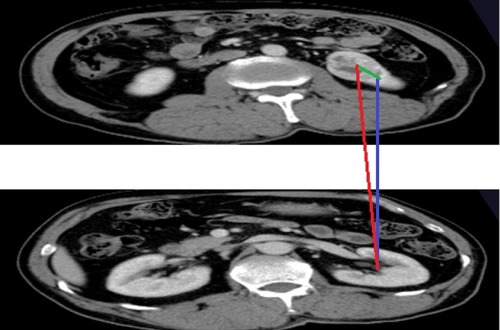
Table 2 Comparison of Clinical Parameters and Anatomical Score of Cases with Different WHO/ISUP Grade
Table 3 Risk Factors for the Differentiation of the High- from Low-Grade ccRCC in the Different Models
Figure 2 ROC curve.
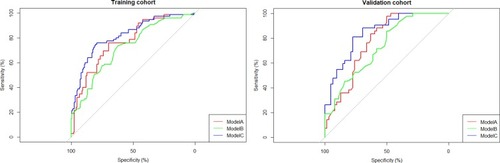
Figure 3 Decision curve analysis. (A) Training cohort. (B) Validation cohort.
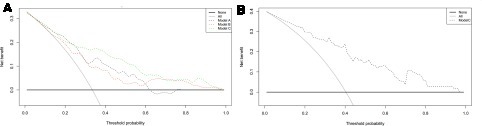
Figure 4 Calibration plot of nomogram. (A) Training cohort. (B) Validation cohort.
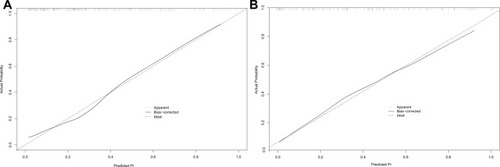
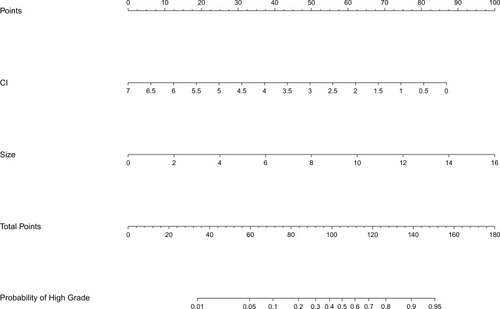
Figure 5 Nomogram evaluating risks of a clear-cell renal cell carcinoma being high grade.