Figures & data
Table 1 Between-Group Differences of Baseline Characteristics
Table 2 Between-Group Differences of Transplantation-Related Complications Incidence
Figure 1 Incidence of (A) aGvHD and (B) cGvHD in the Dec group and the non-Dec group.
Abbreviations: HSCT, hematopoietic stem cell transplantation; aGvHD, acute graft versus host disease; cGvHD, chronic graft versus host disease.
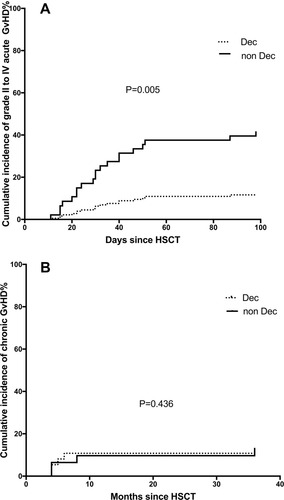
Table 3 Univariate Analysis for II to IV Acute Graft versus Host Disease
Table 4 Multivariate Analysis for Acute Graft versus Host Disease
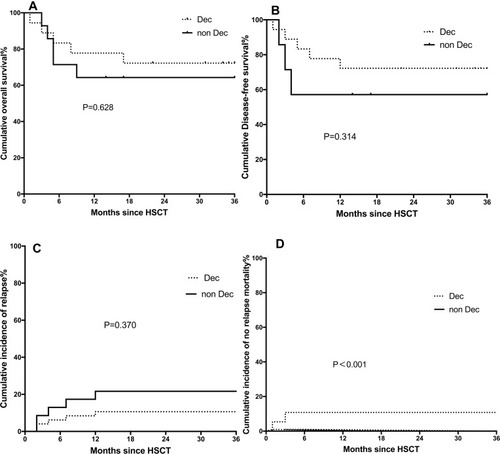
Figure 2 Differences of (A) overall survival (OS), (B) disease-free survival (DFS), (C) relapse rate (RR) and (D) no relapse mortality (NRM) between the Dec group and the non-Dec group of IPSS-R higher-risk patients.
Abbreviations: HSCT, hematopoietic stem cell transplantation; IPSS, international prognostic scoring system.