
Figures & data
Figure 1 NC-CT and CE-CT scans of GACs.
Notes: CT images in the non-contrast phase (A), arterial phase (B), portal venous phase (C), and delayed phase (D) showed a thickened gastric wall. The thickened gastric wall was targeted as the ROI. The ROI was manually drawn along the margin of the lesion (red line).
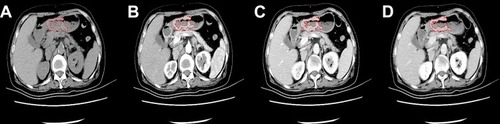
Table 1 Clinicopathological Characteristics of Patients with GACs, Median (Range) or n (%)
Table 2 Dynamic CT Parameters of Patients with GACs, Mean (±SD)
Figure 2 CT parameters between two different HER2 expression groups were compared.
Notes: (A) The CAVs were significantly different between 2 groups in non-contrast (p = 0.005) and arterial (p < 0.001) phases. (B) The cCAVs were significantly different between 2 groups in arterial (p = 0.003) phase. ***p < 0.01.
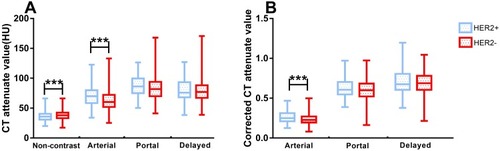
Table 3 Diagnostic Performance of CT Parameters in Distinguishing the HER2 Status
Table 4 Univariate and Multivariate Logistic Regression Analysis for Patients with Gastric Adenocarcinomas