Figures & data
Table 1 Patient and Tumor Characteristics
Table 2 Factors Associated with Patient Outcomes at the Univariate Level
Table 3 Multivariate Analysis of Post-Treatment NLR and PLR for Patient Outcomes
Table 4 Multivariate Analysis of Change in NLR for Patient Outcomes
Table 5 Median PFS After SBRT According to Different Levels of Post-Treatment NLR and PLR
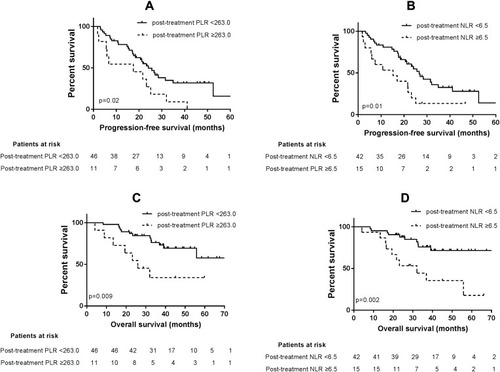
Figure 1 (A–D) Kaplan-Meier survival curves for prognosis according to different levels of post-treatment neutrophil-to-lymphocyte ratio (NLR) and platelet-to-lymphocyte ratio (PLR): (A, B) post-PLR <263.0 and post-NLR <6.5 predicted better progression-free survival with log rank test p-value of p=0.02 and p=0.01, respectively; (C, D): post-PLR <263.0 and post-NLR<6.5 predicted better overall survival with log rank test p-value of p=0.009 and p=0.002, respectively.