Figures & data
Figure 1 Knockdown of lncRNA PCAT-1 suppressed ESCC cell proliferation, invasion and migration. (A) qRT-PCR evaluation of PCAT-1 expression levels in HET1A, EC109, KYSE150 and KYSE450 cells. (B, C) qRT-PCR evaluation of PCAT-1 expression in KYSE150 cells and KYSE450 cells after being transfected with scrambled siRNA (si-NC) or PCAT-1 siRNAs (si-1 and si-2). (D, E) CCK-8 assay determined cell proliferative abilities of KYSE150 and KYSE450 cells after being transfected with different siRNAs. (F, G) Transwell invasion assay evaluated cell invasive abilities of KYSE150 and KYSE450 cells after being transfected with different siRNAs. (H, I) Wound healing assay assessed cell migration of KYSE150 and KYSE450 cells after being transfected with different siRNAs. N = 3. *P<0.05 and **P<0.01.
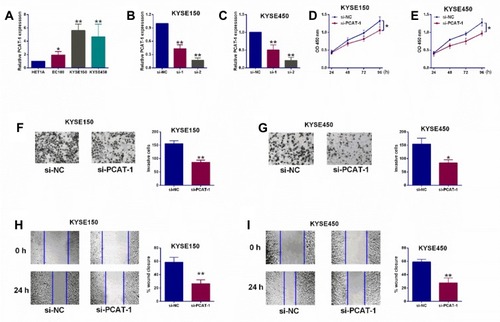
Figure 2 PCAT-1 repressed miR-503-3p expression via acting as a ceRNA. (A) Putative binding sites between PCAT-1 and miR-508-3p as revealed by StarBase online analysis tool. (B) qRT-PCR determination of miR-508-3p expression in KYSE150 cells after being transfected with different miRNAs. (C, D) Dual-Luciferase Reporter assay system determined the luciferase activities in KYSE150 cells after being co-transfected with respective miRNAs and luciferase reporter vectors (PCAT-1-WT or PCAT-1-MUT). (E) qRT-PCR determination of PCAT-1 expression in KYSE150 cells after being transfected with respective miRNAs. (F) qRT-PCR determination of PCAT-1 expression in KYSE150 cells after being transfected with empty vector (pcDNA3.1) or pcDNA3.1-PCAT-1. (G) qRT-PCR determination of miR-508-3p expression in KYSE150 cells after being transfected with empty vector (pcDNA3.1) or pcDNA3.1-PCAT-1. (H) qRT-PCR determination of miR-508-3p expression in KYSE150 cells after being transfected with si-NC or si-PCAT-1. (I–K) CCK-8 assay, transwell invasion assay and wound healing assay, respectively determined the proliferative, invasive and migratory abilities of KYSE cells after being co-transfected with Vector + mimics NC, Vector + miR mimics, PCAT-1 + mimics NC or PCAT-1 + miR mimics. N = 3. *P<0.05, **P<0.01 and ***P<0.001.
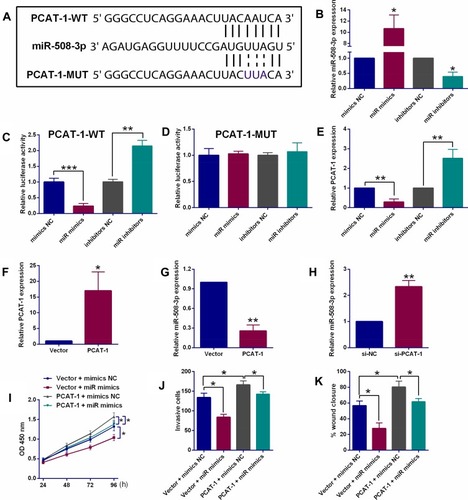
Figure 3 PCAT-1 regulated ESCC progression via modulating ANXA10 expression by acting as a miR-508-3p sponge. (A) Putative binding sites between ANXA10 3ʹUTR and miR-508-3p as revealed by StarBase V3.0 online analysis tool. (B, C) Dual-Luciferase Reporter assay system determined the luciferase activities in KYSE150 cells after being co-transfected with respective miRNAs and luciferase reporter vectors (ANXA10 3ʹUTR-WT or ANXA10 3ʹUTR-MUT). (D, E) qRT-PCR and Western blot assays determined ANXA10 mRNA and protein expression levels in KYSE150 cells after being transfected with respective miRNAs. (F, G) qRT-PCR and Western blot assays determined ANXA10 mRNA and protein expression levels in KYSE150 cells after being transfected with si-NC or si-PCAT-1. (H, I) qRT-PCR and Western blot assays determined ANXA10 mRNA and protein expression levels in KYSE150 cells after being co-transfected with Vector + mimics NC, PCAT-1 + mimics NC or PCAT-1 + miR mimics. (J, K) qRT-PCR and Western blot assays determined ANXA10 mRNA and protein expression levels in KYSE150 cells after being transfected with pcDNA3.1 (Vector) or pcDNA3.1-ANXA10. (L–N) CCK-8 assay, transwell invasion assay and wound healing assay, respectively determined the proliferative, invasive and migratory abilities of KYSE cells after being co-transfected with Vector + mimics NC, Vector + si-NC, ANXA10 + si-NC or ANXA10 + si-PACT-1. N = 3. *P<0.05 and **P<0.01.
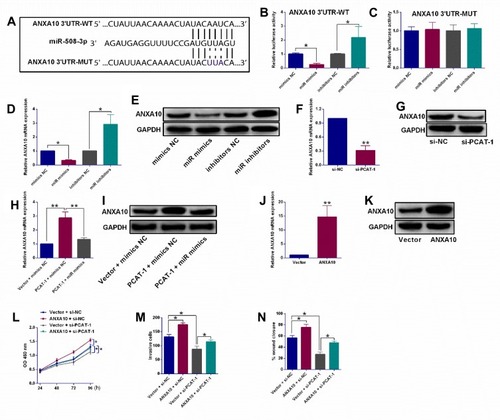
Figure 4 Effects of PCAT-1 knockdown on in vivo tumor growth, and. (A, B) The turmor growth curve and tumor weight in nude mice after being injected with KYSE150 cells expressing sh-NC or sh-PCAT-1. (C, D) qRT-PCR determination of PCAT-1 and miR-508-3p expression in harvested tumor tissues. (E, F) qRT-PCR and Western blot assays assessed ANXA10 mRNA and protein expression of ANXA10 in harvested tumor tissues. N = 5. *P<0.05 and **P<0.01.
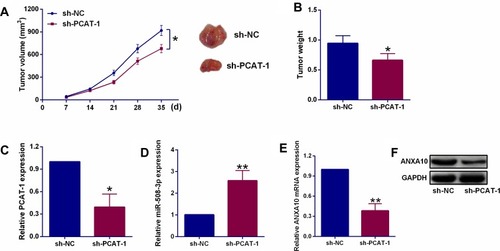
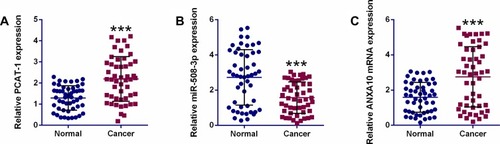
Figure 5 The expression of PCAT-1 and downstream mediators in ESCC clinical samples. qRT-PCR determination of PCAT-1 (A), miR-508-3p (B) and ANXA10 (C) mRNA expression in ESCC tissues (n = 50) and adjacent normal tissues (n = 50). ***P<0.001.