Figures & data
Figure 1 Forced depletion of Cosmc results in Tn antigen expression in breast cancer cells. (A) Schematic depiction of the biosynthesis of mucin-type O-glycans showing the key regulatory role of Cosmc in the process of O-glycosylation. Deletion of Cosmc results in inactive T-synthase and expression of Tn antigen. (B) One pair of single guide RNAs (sgRNAs) was designed to specifically target the Cosmc gene. (C) The knockout of the Cosmc chaperone and the degradation of T-synthase were confirmed by Western blotting in two breast cancer cells. (D) Flow cytometry analysis of Tn antigen expression with anti-Tn antibody. The percentages of Tn-positive cells were 97.1% and 98.3% in Cosmc-deficiency MCF7 and T47D cells, respectively. (E) Western blot analysis showed a strong expression of Tn antigen in MCF7 and T47D Tn-positive cells compared to the control cells. The membrane was blotted with HPR-labeled HPA.
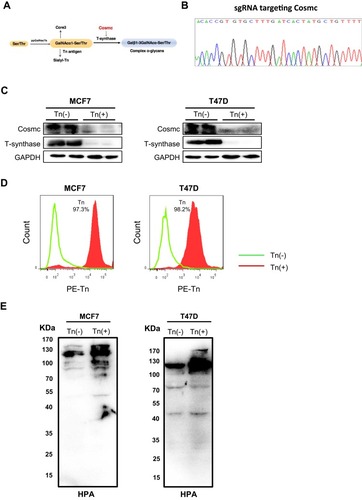
Figure 2 Cosmc disruption-mediated aberrant O-glycosylation inhibits cellular growth in vitro. (A) A RTCA assay was performed to determine the cell growth curves. MCF7 and T47D cell numbers were analyzed by RTCA at different time points up to 160 hrs. Data were presented as the means±SD from four replicated wells. (*** P < 0.001). Both Tn-positive cells had decreased cell proliferation rate relative to the control Tn-negative cells. (B) Colony formation assay was performed in MCF7 and T47D cells. The results showed that both Tn-positive MCF7 and T47D cells formed fewer colonies than the control Tn-negative cells.
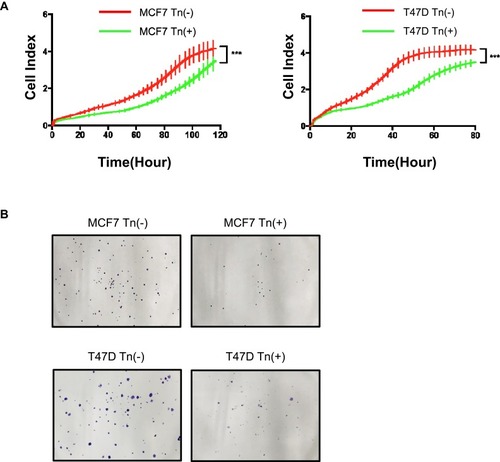
Figure 3 Cosmc disruption delays tumor growth in vivo. (A) Effects of Cosmc disruption on tumor growth and proliferation in a Balb/c nude mouse model. Tn-positive MCF7 and T47D cells as well as the corresponding Tn-negative cells were subcutaneously injected into mice. Six mice were used for each group. Images of the excised tumors were shown. (B) The volume of tumors was measured at different time points in 21 days (*** P < 0.001). (C) Tumor weight of Tn-positive MCF7 and T47D cell tumors in nude mice compared with control cell tumors (*** P < 0.001). (D) Cell proliferation of tumors was evaluated by immunohistochemical staining of Ki67, and representative images were shown. The results showed that the size and weight of Tn-positive xenotransplants were reduced compared with Tn-negative xenotransplants. Besides, the number of Ki67-positive cells were fewer in mice treated with Tn-positive cells than in mice treated with Tn-negative cells.
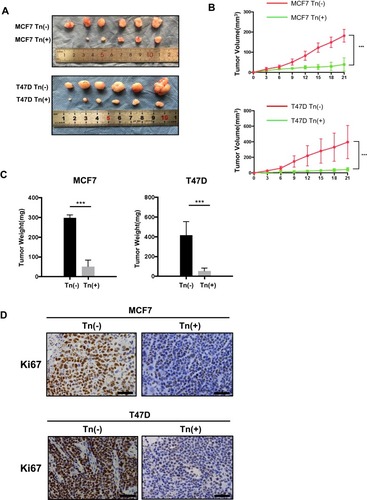
Figure 4 CD44 expression and the associated MAPK signaling pathway were impaired in Tn-positive cancer cells. (A) The expression of CD44 at its protein levels was determined by Western blot analysis. It showed that Cosmc deficiency drastically reduced the expression of CD44 in Tn-positive MCF7 and T47D cells compared with the corresponding Tn-negative control cells. (B) Quantitative RT-PCR analysis showed that the mRNA levels of CD44 were not different between the Tn-positive and Tn-negative MCF7 and T47D cells. ns indicates no significant difference. (C) Cosmc disruption inhibited the phosphorylation of the MAPK signaling pathway. The expression levels of ERK1/2, p-ERK1/2, JNK, p-JNK, p38 and p-p38 were determined by Western blot analysis.
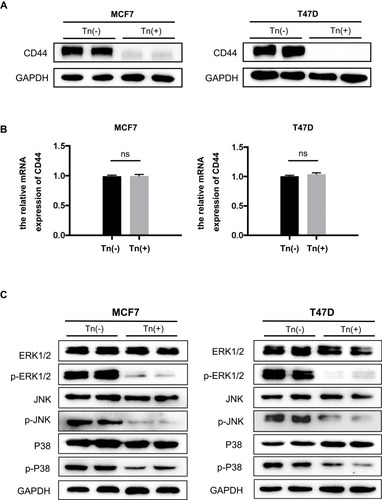
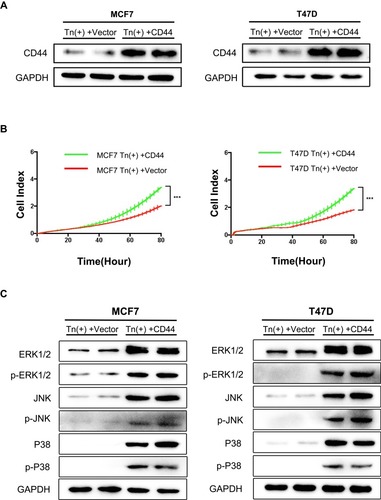
Figure 5 Re-expression of CD44 in Tn-positive cells reversed the inhibitory effects. (A) Re-expression of CD44 in Tn-positive MCF7 cells and T47D cells was analyzed by Western blot. (B) RTCA was performed to measure the cell proliferation rate. Data were represented as the means±SD from four replicated wells. (*** P < 0.001). (C) Expression of ERK1/2, p-ERK1/2, JNK, p-JNK, p38 and p-p38 was determined by Western blot analysis in Tn-positive cells transfected with CD44.