Figures & data
Table 1 Clinicopathological Characteristics of the Training and Validation Groups
Table 2 Univariate and Multivariate Analyses of DFS in the Training Group
Table 3 Univariate and Multivariate Analyses of OS in the Training Group
Figure 1 Kaplan–Meier survival curves in subgroups with different AGR or NLR of the training group. (A, B) Disease-free survival. (C, D) Overall survival.
Abbreviations: AGR, albumin-to-globulin ratio; NLR, neutrophil-to-lymphocyte ratio.
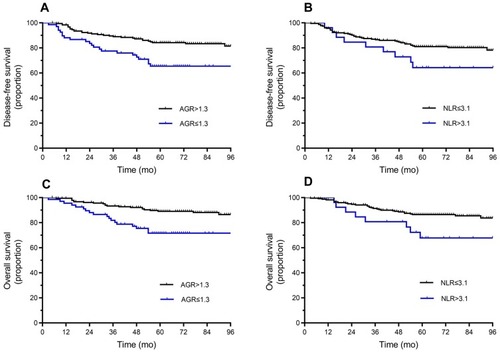
Figure 2 Nomogram for the prediction of DFS in triple-negative breast cancer.
Abbreviations: DFS, disease-free survival; AGR, albumin-to-globulin ratio; NLR, neutrophil-to-lymphocyte ratio.
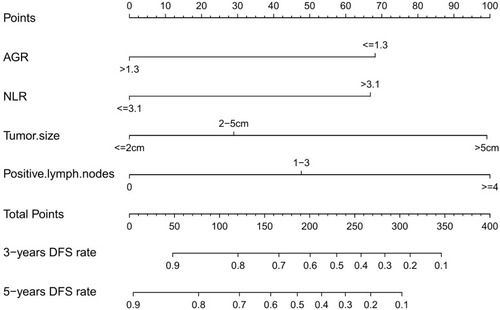
Figure 3 Nomogram for the prediction of OS in triple-negative breast cancer.
Abbreviations: OS, overall survival; AGR, albumin-to-globulin ratio; NLR, neutrophil-to-lymphocyte ratio.
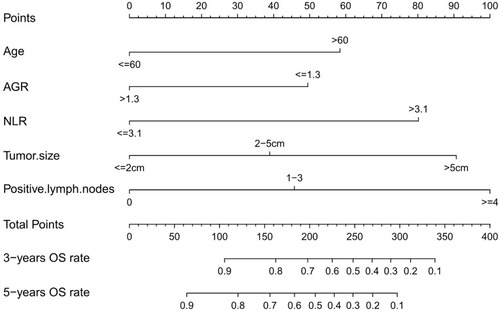
Figure 4 Calibration curves for predicting the OS and DFS for patients with triple-negative breast cancer in the training group at (A, C) 3 years and (B, D) 5 years. Nomogram-predicted probability is plotted on the x-axis and the actual survival is plotted on the y-axis.
Abbreviations: DFS, disease-free survival; OS, overall survival.
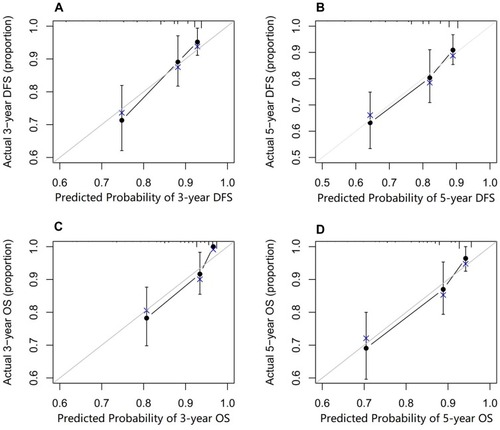
Figure 5 Calibration curves for predicting the OS and DFS for patients with triple-negative breast cancer in the validation group at (A, C) 3 years and (B, D) 5 years. Nomogram-predicted probability is plotted on the x-axis and the actual survival is plotted on the y-axis.
Abbreviations: DFS, disease-free survival; OS, overall survival.
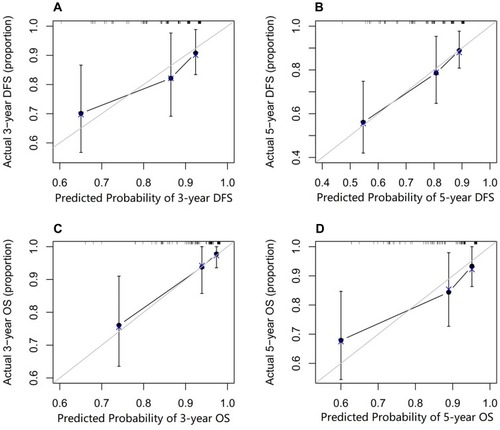
Figure 6 Time-dependent AUC of OS and DFS (A, B). Difference of AUC between the prediction models and the TNM staging system (C, D).
Abbreviations: AUC, area under curve; OS, overall survival; DFS, disease-free survival; TNM, Tumor-Node-Metastasis.
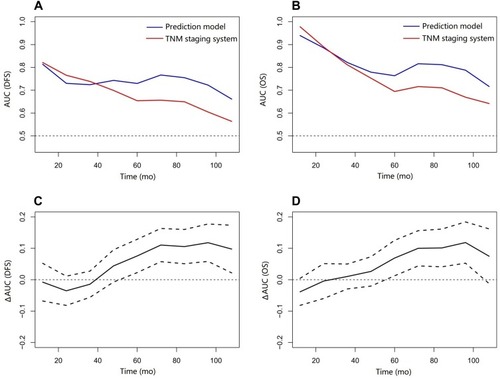
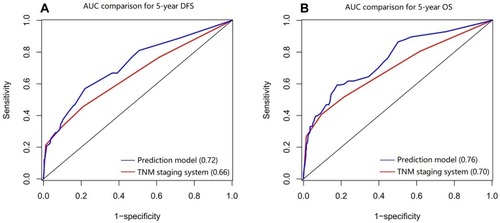
Figure 7 Five-year ROC curves.
Abbreviations: ROC, receiver operating characteristic; AUC, area under curve; DFS, disease-free survival; OS, overall survival; TNM, Tumor-Node-Metastasis.