
Figures & data
Table 1 Patients Baseline and Disease Characteristics (Totals Patients, N=208)
Figure 1 The overall survival (OS), progression-free survival (PFS), and time to progression (TTP) curves of the HTN and non-HTN groups were plotted using the Kaplan–Meier method. (A) Overall survival curves of HTN group (17.4m) and non-HTN group (12.5m) before the PSM (1:1) (Log-rank test, p=0.001). (B) Overall survival curves of HTN group (17.4m) and non-HTN group (12.3m) after the PSM (1:1) (Log-rank test, p=0.001). (C) Progression-free survival curves of HTN group (7.4m) and non-HTN group (4.7m) before the PSM (1:1) (log-rank test, p=0.000). (D) Progression-free survival curves of HTN group (7.6m) and non-HTN group (4.1m) after the PSM (1:1) (Log-rank test, p=0.003). (E) Time to progression curves of HTN group (8.4m) and non-HTN group (5.7m) before the PSM (1:1) (log-rank test, p=0.000). (F) Time to progression curves of HTN group (9.0m) and non-HTN group (5.5m) after the PSM (1:1) (Log-rank test, p=0.003).
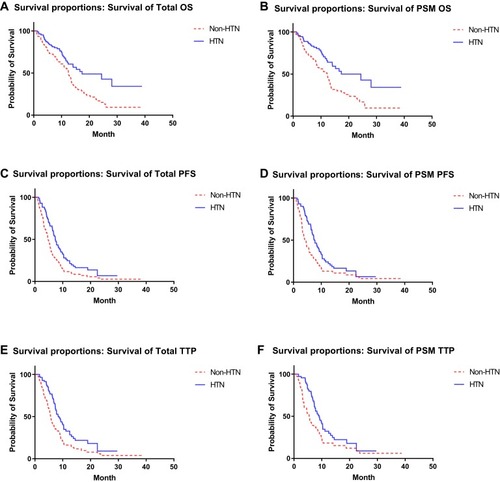
Table 2 Short-Term Effects of Patients (Totals Patients, N=208)
Table 3 Univariate and Multivariate Analyses of Variables Affecting OS and PFS in Patients (Totals Patients, N=208)
Figure 2 Subgroup analysis of OS and PFS. (A) Subgroup with AFP >400μg/L, whether HTN can be a predictor of OS; (B) subgroup with AFP >400μg/L, whether HTN can be a predictor of PFS; (A, B) In patients with AFP ≤400μg, drug-related HTN can be used as a predictor of OS (p=0.006) and PFS (p=0.021). In patients with AFP >400μg, drug-related HTN cannot be used as a predictor of OS (p=0.081), but can be used as a predictor of PFS (p=0.007). (C) Subgroup with Child-Pugh Score, whether HTN can be a predictor of OS; (D) subgroup with Child-Pugh Score, whether HTN can be a predictor of PFS; (C, D) in patients with Child-Pugh A, drug-related HTN can be used as a predictor of OS (p=0.003) and PFS (p=0.012). In patients with Child-Pugh B, drug-related HTN cannot be used as a predictor of OS (p=0.267), but can be used as a predictor of PFS (p=0.010). (E) Subgroup with macrovascular invasion, whether HTN can be a predictor of OS; (F) subgroup with macrovascular invasion, whether HTN can be a predictor of PFS; (E, F) in patients without macrovascular invasion, drug-related HTN can be used as a predictor of OS (p=0.024), but not as a predictor of PFS (p=0.072). In patients with macrovascular invasion, drug-related HTN can be used as a predictor of OS (p=0.021) and PFS (p=0.001). (G) Subgroup with extrahepatic spread, whether HTN can be a predictor of OS; (H) subgroup with extrahepatic spread, whether HTN can be a predictor of PFS. (G, H) In patients without extrahepatic metastases, drug-related HTN cannot be used as a predictor of OS (p=0.078), but can be used as a predictor of PFS (p=0.035). In patients with extrahepatic spread, drug-related HTN can be used as a predictor of OS (p=0.005) and PFS (p=0.000).
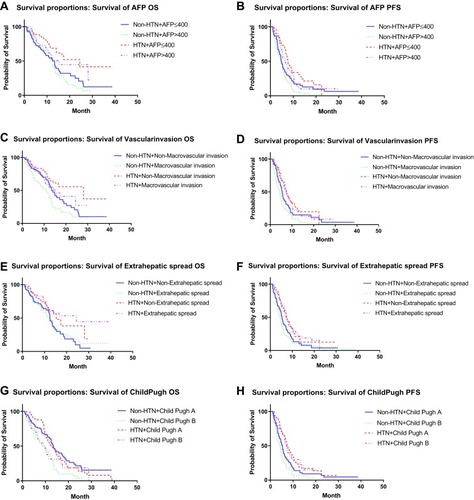
Figure 3 The Kaplan-Meier plot shows the overall survival rate for a combination of radiological outcomes based on changes in blood pressure after administration and 6 months later by modified Response Evaluation Criteria in Solid Tumors. The overall survival of patients with PFS >6 months was significantly better than patients with PFS ≤6 months, with or without drug-related HTN. However, the drug-related HTN cannot be used as a predictor of OS in these two groups of patients.
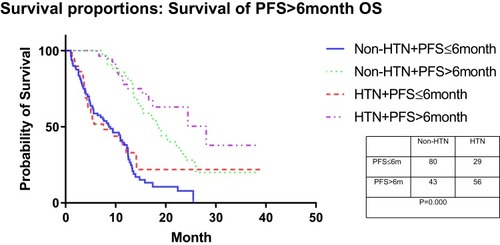
Table 4 Adverse Events Profile Based on Apatinib Treatment (Totals Patients, N=208)