Figures & data
Figure 1 Schematic overview of the procedure for molecular analysis of CTC and tumor tissue.
Figure 2 Mechanism of CTC isolation and detection CellCollector. (A) Pictorial representation of the CellCollector wire and its application. (B) Representative pictures of WBCs and CTC (bar = 10 μm). EpCAM antibodies coated wire facilitates binding of EpCAM positive cells when exposed into the arm vein of cancer patients. (C) Identification of EpCAM/CKs positive CTC from patients. Cancer cells were observed for EpCAM- and/or pan-keratin-positive (green) and CD45-negative (red) events. Nuclear counterstaining (blue) was performed by Hoechst33342 (bar = 10 μm). (D) The CTC detection rate in lung cancer patients and healthy control. (E) The CTC detection in stage I and stage II. (F) The CTC detection in male and female. (G) The CTC detection in person with differential smoking history [NS, never smoker; FS, former smoker; CS, current smoker]. (H) The CTC detection rate in three types of tumor size: ≤3 cm, 3–5 cm and >5 cm.
![Figure 2 Mechanism of CTC isolation and detection CellCollector. (A) Pictorial representation of the CellCollector wire and its application. (B) Representative pictures of WBCs and CTC (bar = 10 μm). EpCAM antibodies coated wire facilitates binding of EpCAM positive cells when exposed into the arm vein of cancer patients. (C) Identification of EpCAM/CKs positive CTC from patients. Cancer cells were observed for EpCAM- and/or pan-keratin-positive (green) and CD45-negative (red) events. Nuclear counterstaining (blue) was performed by Hoechst33342 (bar = 10 μm). (D) The CTC detection rate in lung cancer patients and healthy control. (E) The CTC detection in stage I and stage II. (F) The CTC detection in male and female. (G) The CTC detection in person with differential smoking history [NS, never smoker; FS, former smoker; CS, current smoker]. (H) The CTC detection rate in three types of tumor size: ≤3 cm, 3–5 cm and >5 cm.](/cms/asset/f16c8d68-03cd-4b6a-8fc3-aaad2cf0b34b/dcmr_a_12187178_f0002_c.jpg)
Figure 3 PD-L1 expression and CTC cluster analysis. (A) PD-L1 expression in tumor tissue. (B) PD-L1 expression in CTC of cancer patients (bar = 10 μm). (C) Immuno-staining differentiates PD-L1 expression in positive and negative control (bar = 10 μm). (D) Represent CTC cluster in patients. (E) Detection rate, CTC cluster rate and PD-L1 positive rate (≥1 PD-L1+ CTC) of lung cancer patients.
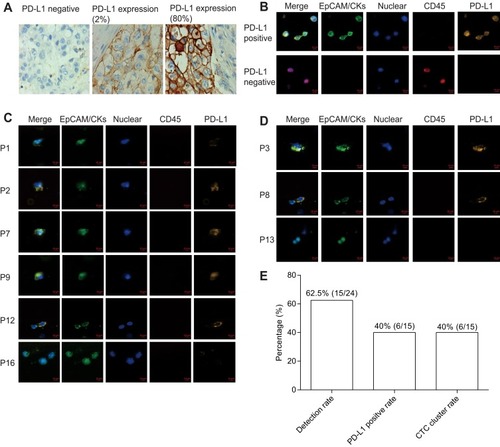
Figure 4 Genomic mutation analysis between CTC and tumor tissue using NGS. (A–D) Flow chart of CTC genomic DNA extraction. (E) Consistency of mutation between tumor tissue and CTC, mean value was shown as dotted line. (F) Detection rate of mutation in CTC showing different mutation load in tumor tissue.
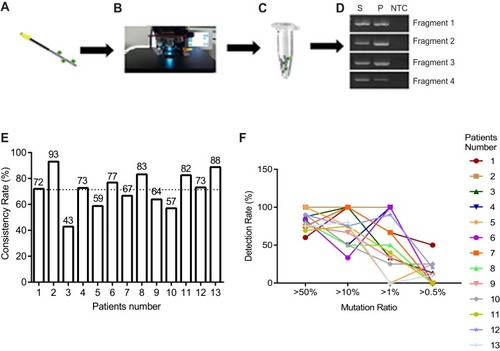
Table 1 Mutation Sites of 50 Genes from 13 Patients
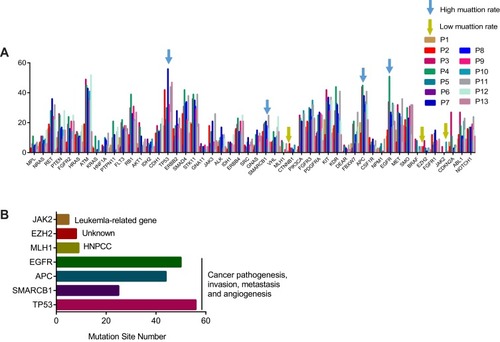
Figure 5 CTC genomic mutation analysis of 13 patients for 50 genes’ panel. The mutation sites number for each gene identified by second-generation sequencing in 13 patients (each bar represented one gene for an individual patient).
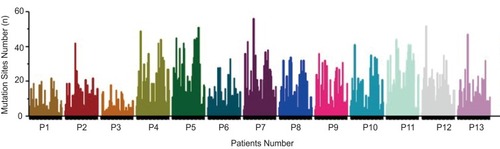
Figure 6 Functional analysis of gene mutation in CTC genome. (A) Mutation rate of cancer-driven genes in subjects, blue arrow indicates high mutation rate, yellow arrow indicates low mutation rate. Different color indicates individual subject. (B) Gene annotation of indicated genes including three low mutational genes (JAK2, EZH2, MLH1) and four high mutational genes (EGFR, APC, SMARCB1, TP53).