
Figures & data
Table 1 Baseline Characteristics of the Patients
Table 2 Hazard Ratios for Death in Subgroups
Figure 1 Kaplan–Meier estimates of OS. Shown are data for OS. The dashed lines indicate the median. The median rate of OS was not reached in the ADT + docetaxel group and was 31.6 months in the ADT group; CI, confidence interval; NR, not reached. No. at Risk denotes the number at risk is the number of individuals at risk, defined as all those under study who died or were censored at a time later than the current time.
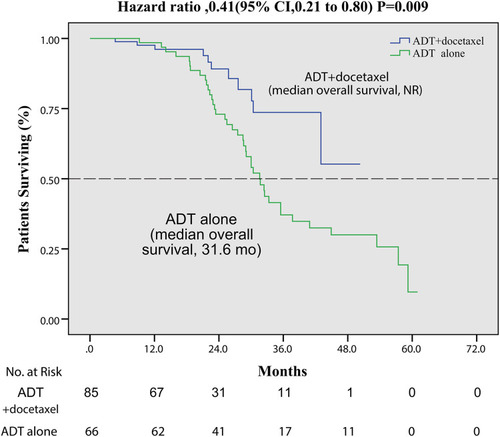
Figure 2 Kaplan–Meier estimates of PSA PFS. Data are shown for PSA PFS. The dashed lines indicate the median. The median rate of PSA PFS was 17.9 months in the ADT + docetaxel group and was 9.2 months in the ADT group; CI, confidence interval. No. at Risk denotes the number at risk is the number of individuals at risk, defined as all those under study who died or were censored at a time later than the current time.
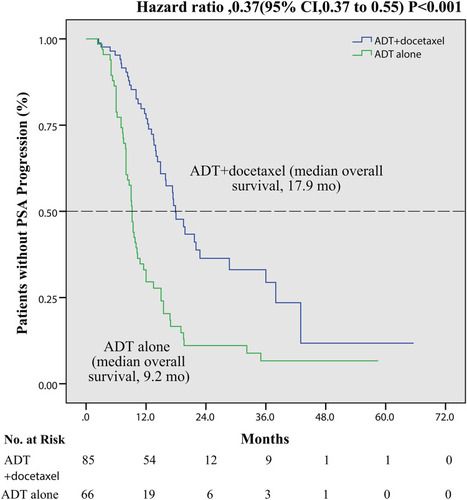
Figure 3 Kaplan–Meier estimates of radiographic PFS. Data are shown for radiographic PFS. The dashed lines indicate the median. The median rate of radiographic PFS was 43 months in the ADT + docetaxel group and was 19.8 months in the ADT group; CI, confidence interval. No. at Risk denotes the number at risk is the number of individuals at risk, defined as all those under study who died or were censored at a time later than the current time.
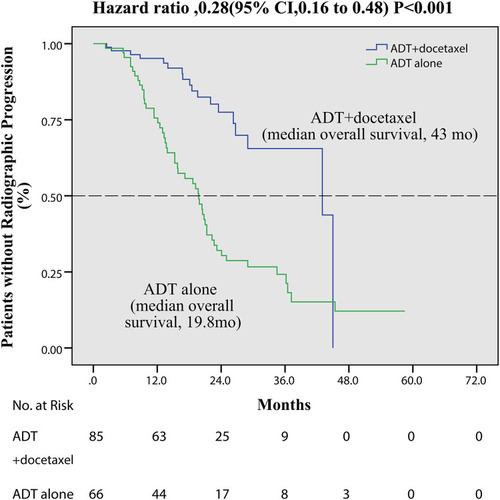
Table 3 Characteristics of Clinical Trials Related to Docetaxel