Figures & data
Table 1 Correlation Between Relative Circ_0000885 Expression and the Clinical Pathological Characteristics of OS Patients
Figure 1 Circ_0000885 had high expression in OS. (A) The expression of circ_0000885 was examined by qRT-PCR in OS tumor tissues (Tumor) and matched normal tissues (Normal). (B) QRT-PCR was used to detect the circ_0000885 expression in OS cells (Saos-2 and SOSP-9607) and hFOB cells. *P < 0.05.
Abbreviations: OS, osteosarcoma; qRT-PCR, quantitative real-time polymerase chain reaction.
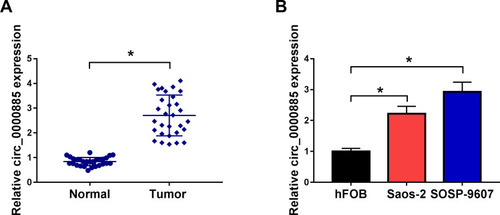
Figure 2 Knockdown of circ_0000885 decreased proliferation, arrested cell cycle, inhibited migration and invasion in OS cells. Saos-2 and SOSP-9607 cells were transfected with si-circ_0000885 or si-NC. (A) The relative expression of circ_0000885 was determined using qRT-PCR. (B–D) MTT assay and colony formation assay were used to measure the proliferation of Saos-2 and SOSP-9607 cell. (E and F) Cell cycle distribution was tested using flow cytometry. (G and H) Transwell assay was used to assess the migration and invasion abilities of Saos-2 and SOSP-9607 cells. *P < 0.05.
Abbreviations: OS, osteosarcoma; si, small interfering RNA; NC, negative control; MTT, 3-(4,5-dimethyl-2-thiazolyl)-2, 5-diphenyltetrazolium bromide; G0/G1, DNA synthesis prophase; S, DNA synthesis phase; G2/M, DNA synthesis anaphase/cell division phase; OD, optical density; FL2-A-PE-A, the area of fluorescence; qRT-PCR, quantitative real-time polymerase chain reaction.
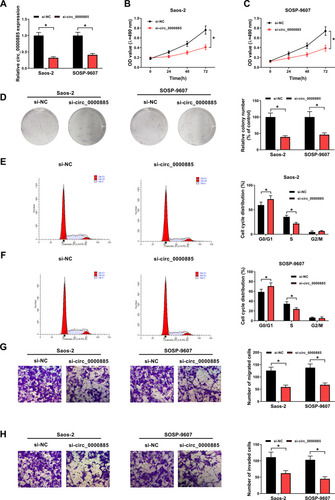
Figure 3 Circ_0000885 directly targeted miR-1294 in OS. (A) Predicted binding sites or mutant binding sites in circ_0000885 for miR-1294 were shown. (B and C) The luciferase activity of circ_0000885-WT or circ_0000885-MUT was measured using the dual-luciferase reporter assay. (D) The expression of miR-1294 in OS tumor tissues (Tumor) and matched normal tissues (Normal) was determined by qRT-PCR. (E) MiR-1294 expression in OS cells (Saos-2 and SOSP-9607) and hFOB cells was measured using qRT-PCR. (F) The correlation between circ_0000885 and miR-1294 was analyzed via Pearson correlation analysis. (G) QRT-PCR was employed to assess the miR-1294 expression in Saos-2 and SOSP-9607 cells transfected with si-circ_0000885 or si-NC. *P < 0.05.
Abbreviations: OS, osteosarcoma; WT, wild-type; MUT, mutant-type; NC, negative control; si, small interfering RNA; qRT-PCR, quantitative real-time polymerase chain reaction.
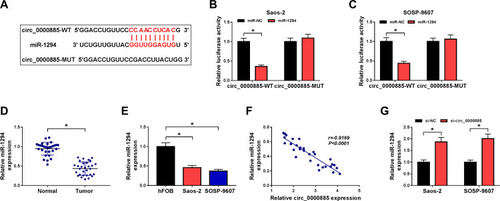
Figure 4 Circ_0000885 regulated the progression of OS via targeting miR-1294. Saos-2 and SOSP-9607 cells were transfected with si-NC, si-circ_0000885, si-circ_0000885 + anti-miR-NC or si-circ_0000885 + anti-miR-1294, respectively. (A) Relative miR-1294 expression in Saos-2 and SOSP-9607 cells was measured by qRT-PCR. (B–D) MTT assay and colony formation assay were performed to test the proliferation of Saos-2 and SOSP-9607 cells. (E and F) Flow cytometry was employed to evaluate the cell cycle distribution of Saos-2 and SOSP-9607 cells. (G and H) The migration and invasion abilities of Saos-2 and SOSP-9607 cells were determined via transwell assay. *P < 0.05.
Abbreviations: OS, osteosarcoma; si, small interfering RNA; NC, negative control; OD, optical density; G0/G1, DNA synthesis prophase; S, DNA synthesis phase; G2/M, DNA synthesis anaphase/cell division phase; MTT, 3-(4,5-dimethyl-2-thiazolyl)-2, 5-diphenyltetrazolium bromide; qRT-PCR, quantitative real-time polymerase chain reaction.
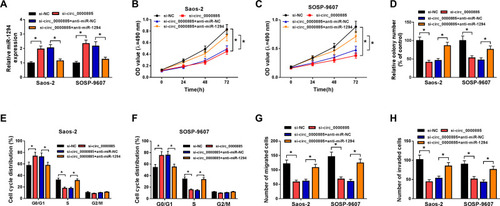
Figure 5 FGFR1 was a target of miR-1294 in OS. (A) The sequences of FGFR1 3ʹUTR-WT or FGFR1 3ʹUTR-MUT were exhibited. (B and C) Dual-luciferase reporter assay was performed to measure the luciferase activity of FGFR1 3ʹUTR-WT or FGFR1 3ʹUTR-MUT in Saos-2 and SOSP-9607 cells transfected with miR-1294 mimic or miR-NC. (D and E) The mRNA and protein expression of FGFR1 in OS tumor tissues (Tumor) and matched normal tissues (Normal) was detected by qRT-PCR and WB analysis, respectively. (F and G) QRT-PCR and WB analysis were used to determine the mRNA and protein expression of FGFR1 in OS cells (Saos-2 and SOSP-9607) and hFOB cells. (H) Pearson correlation analysis was employed to assess the correlation between miR-1294 and FGFR1 expression in OS. (I and J) QRT-PCR and WB analysis were employed to evaluate the mRNA and protein expression of FGFR1 in Saos-2 and SOSP-9607 cells transfected with miR-1294 mimic or miR-NC. *P < 0.05.
Abbreviations: OS, osteosarcoma; WT, wild-type; MUT, mutant-type; NC, negative control; GAPDH, glyceraldehyde 3-phosphate dehydrogenase; WB, Western blot; qRT-PCR, quantitative real-time polymerase chain reaction.
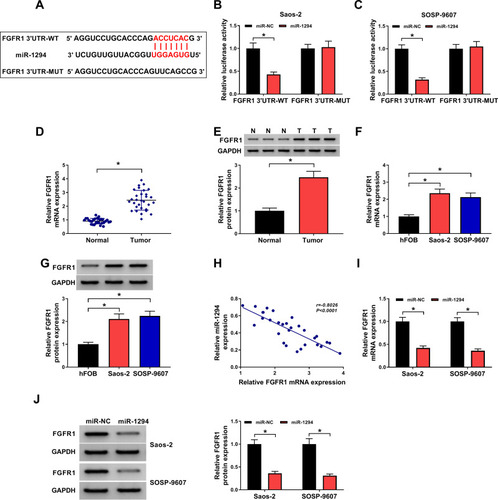
Figure 6 FGFR1 was involved in the regulation of miR-1294 on OS progression. Saos-2 and SOSP-9607 cells were transfected with miR-NC, miR-1294, miR-1294 + pcDNA-NC or miR-1294 + pcDNA-FGFR1, respectively. (A and B) The mRNA and protein expression of FGFR1 was determined using qRT-PCR and WB analysis. (C–E) The proliferation of Saos-2 and SOSP-9607 cells was evaluated using MTT assay and colony formation assay. (F and G) The cell cycle distribution of Saos-2 and SOSP-9607 cells was examined using flow cytometry. (H and I) The migration and invasion abilities of Saos-2 and SOSP-9607 cells were detected using transwell assay. *P < 0.05.
Abbreviations: OS, osteosarcoma; NC, negative control; GAPDH, glyceraldehyde 3-phosphate dehydrogenase; OD, optical density; G0/G1, DNA synthesis prophase; S, DNA synthesis phase; G2/M, DNA synthesis anaphase/cell division phase; MTT, 3-(4,5-dimethyl-2-thiazolyl)-2, 5-diphenyltetrazolium bromide; WB, Western blot; qRT-PCR, quantitative real-time polymerase chain reaction.
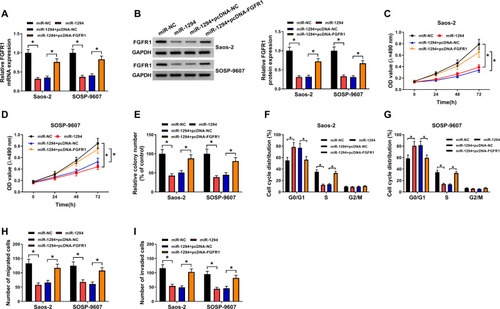
Figure 7 FGFR1 expression was regulated by circ_0000885 and miR-1294. (A) Pearson correlation analysis was used to evaluate the correlation between FGFR1 and circ_0000885 expression in OS. (B and C) After transfected with si-NC, si-circ_0000885, si-circ_0000885 + anti-miR-NC or si-circ_0000885 + anti-miR-1294, the mRNA and protein expression of FGFR1 in Saos-2 and SOSP-9607 cells was determined by qRT-PCR and WB analysis, respectively. *P < 0.05.
Abbreviations: OS, osteosarcoma; si, small interfering RNA; NC, negative control; GAPDH, glyceraldehyde 3-phosphate dehydrogenase; WB, Western blot; qRT-PCR, quantitative real-time polymerase chain reaction.
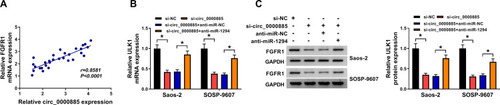
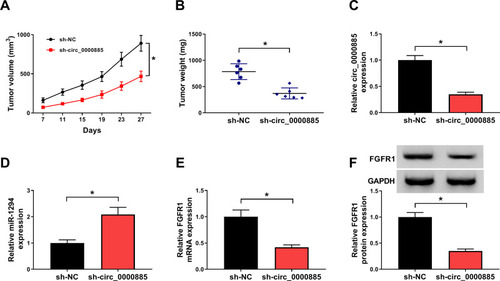
Figure 8 Interference of circ_0000885 inhibited OS tumor growth in vivo. (A) Tumor volume was calculated by recording the length and width of the tumor. (B) Tumor weight was weighed after removed tumors from mice. (C–E) The expression of circ_0000885, miR-1294 and FGFR1 in the sh-circ_0000885 group and the sh-NC group was measured using qRT-PCR. (F) The protein level of FGFR1 in the sh-circ_0000885 group and the sh-NC group was detected by WB analysis. *P < 0.05.
Abbreviations: OS, osteosarcoma; sh, lentiviral short hairpin RNA; NC, negative control; GAPDH, glyceraldehyde 3-phosphate dehydrogenase; WB, Western blot; qRT-PCR, quantitative real-time polymerase chain reaction.