Figures & data
Figure 1 UPF3a was overexpressed in CRC cells and tumor tissues. (A) UPF3a mRNA was detected with real-time quantitative polymerase chain reaction test in tumor tissues, paired peritumoral tissues and distant liver metastatic tissues, respectively. C121, C633 and E702 means the serial number of the patients tissues. (B) Western blotting assay was used to detect UPF3a protein expression in tumor tissues (T), paired peritumoral tissues (P) and distant liver metastatic tissues (M), respectively. C832, F135, C121 and F216 means the serial number of the patients tissues. (C) Immunohistochemistry (IHC) assay showed UPF3a protein expression in tumor tissues compared with paired peritumoral tissues. Magnification: ×200, left panels; ×400, right panels. (D) Statistical analysis showed significant disparity of UPF3a expression between tumor tissues and paired peritumoral tissues. ***Means p<0.001. (E) UPF3a mRNA was detected by real-time quantitative polymerase chain reaction test in 10 CRC cells and 2 normal epithelial cells (CCD841 and NCM460), respectively. (F) TCGA data showed UPF3a expression level in different stages (I/II,III and IV) of CRC tumor tissues. *Means p<0.05, **means p <0.01. (G) TCGA data showed UPF3a expression level in tumor tissues of patients with (M1) or without (M0) distant liver metastasis. **Means p <0.01.
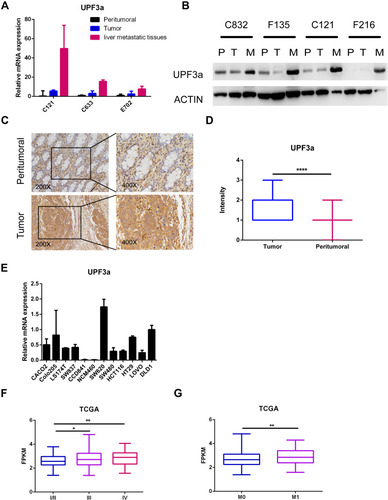
Figure 2 Alteration of UPF3a expression affects cell mobility. (A) UPF3a knockdown was confirmed in HCT116 cells by real-time quantitative polymerase chain reaction test. (B) The effects of UPF3a knockdown on migration were detected by Transwell-migration assays in HCT116 cells (magnification: ×40). (C) UPF3a knockdown was confirmed in Lovo cells by real-time quantitative polymerase chain reaction test. (D) The effects of UPF3a knockdown on migration were detected by Transwell-migration assays in Lovo cells (magnification: ×40). (E) UPF3a overexpression was confirmed in HCT116 cells and LOVO cells by real-time quantitative polymerase chain reaction test. (F) The effects of UPF3a overexpression on migration were detected by Transwell-migration assays in HCT116 cells (magnification: ×40). (G) The effects of UPF3a overexpression on migration were detected by Transwell-migration assays in LOVO cells (magnification: ×40) (H) Statistical analysis of migration ability of the effects of UPF3a knockdown in HCT116 cells and LOVO cells. ***Means p <0.001. (I) Statistical analysis of migration ability of the effects of UPF3a overexpression in HCT116 cells and LOVO cells. *Means p<0.05, **means p <0.01. (J) The migratory capacity of UPF3a depletion or control in HCT116 cells were determined by wound‐healing assay. The extent of migration was determined at 72 hr. After the initial scratch wound (magnification: ×40). **Means p <0.01, ***means p <0.001.
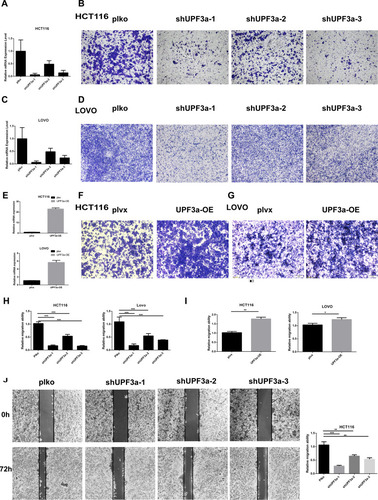
Table 1 Correlations of UPF3a Expression with Clinicopathological Characteristics of CRC Patients
Table 2 Univariable and Multivariable Analysis of OS and Clinicopathological Variables of CRC Patients
Table 3 Univariable and Multivariable Analysis of DFS and Clinicopathological Variables of CRC Patients
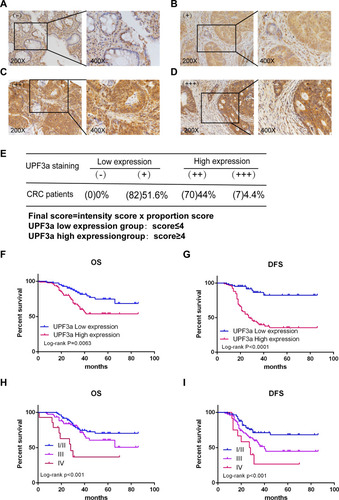
Figure 3 High UPF3a expression correlates with poor survival of CRC patients. (A–D) IHC analysis of different UPF3a expression in CRC patients (magnification: ×200, left panels; ×400, right panels). (A–D) represents negative (-), weakly positive (+), moderately positive (++), and strongly positive (+++) UPF3a expression, respectively. (E) The detailed scoring method of UPF3a expression. (F, G) The Kaplan–Meier plots were stratified by UPF3a expression for disease-free survival and overall survival in CRC patients. Log‐rank test was performed to assess statistical significance. OS: overall survival; DFS:disease-free survival. (H, I) The Kaplan–Meier plots were stratified by tumor stage (I/II, III and IV) for disease-free survival and overall survival in CRC patients. Log rank test was performed to assess statistical significance.
Abbreviations: OS, overall survival; DFS, disease-free survival.