Figures & data
Table 1 Clinical Characteristics of the Study Participants
Figure 1 miR-331-3p was down-regulated in NSCLC. (A) miR-331-3p expression levels were measured in tumor tissues and adjacent normal tissues extracted from 26 NSCLC patients using RT-qPCR. (B) miR-331-3p expression levels were measured by RT-qPCR in six NSCLC cell lines, BEAS-2b, A549, H1650, H292, H1299 and H1944. All quantitative values were the average of three independent experiments. *P<0.05,**P<0.01,***P<0.001.
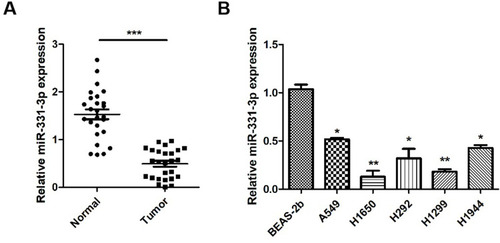
Figure 2 miR-331-3p inhibited tumor cell proliferation in NSCLC. (A) miR-331-3p expression levels were detected in A549, H1944 and H1299 cells transfected with inhibitor-NC or inhibitor-miR-331-3p through RT-qPCR. (B) Cell viabilities of A549 cells transfected with inhibitor-NC or inhibitor-miR-331-3p from Day1 to Day5 with the support of CCK-8 assay. (C) Cell viabilities of H1944 cells transfected with inhibitor-NC or inhibitor-miR-331-3p from Day1 to Day5 with the support of CCK-8 assay. (D) Cell viabilities of H1299 cells transfected with inhibitor-NC or inhibitor-miR-331-3p from Day1 to Day5 with the support of CCK-8 assay. (E) miR-331-3p expression levels were detected in A549, H1650 and H1299 cells transfected with mimic-NC or mimic-miR-331-3p through RT-qPCR. (F) Cell viabilities of H1299 cells transfected with mimic-NC or mimic-miR-331-3p from Day1 to Day5 with the support of CCK-8 assay. (G) Cell viabilities of H1650 cells transfected with mimic-NC or mimic-miR-331-3p from Day1 to Day5 with the support of CCK-8 assay. (H) Cell viabilities of H1299 cells transfected with mimic-NC or mimic-miR-331-3p from Day1 to Day5 with the support of CCK-8 assay. All quantitative values were the average of three independent experiments. *P<0.05,**P<0.01,***P<0.001.
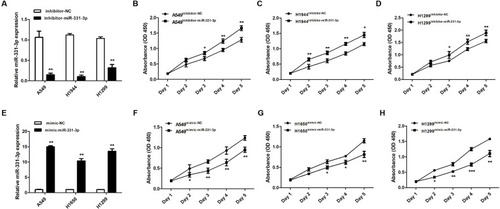
Figure 3 MLLT10 was the downstream gene of miR-331-3p in NSCLC. (A) The sequences of miR-331-3p and MLLT10 3ʹUTR (position 1470–1494). (B) The luciferase activities of H1650 cells transfected with pGL3 vector containing MLLT10 3ʹUTR and mimic-NC or mimic-miR-331-3p using a dual-luciferase activity assay.(C) The luciferase activities of H1650 cells transfected with pGL3 vector containing MLLT10 3ʹUTRmut and mimic-NC or mimic-miR-331-3p using a dual-luciferase activity assay.(D) The luciferase activities of H1299 cells transfected with pGL3 vector containing MLLT10 3ʹUTR and mimic-NC or mimic-miR-331-3p using a dual-luciferase activity assay.(E) The luciferase activities of H1299 cells transfected with pGL3 vector containing MLLT10 3ʹUTRmut and mimic-NC or mimic-miR-331-3p using a dual-luciferase activity assay. All quantitative values were the average of three independent experiments. **P<0.01.
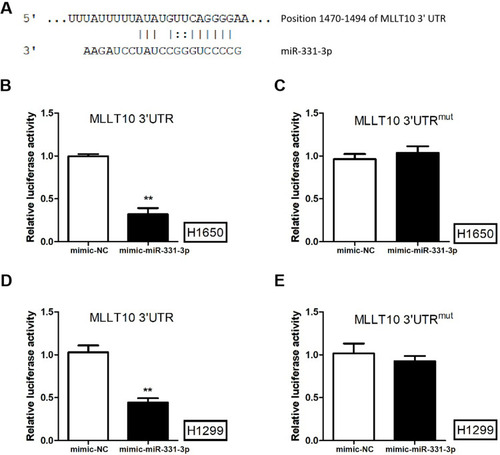
Figure 4 MLLT10 was regulated by miR-331-3p negatively in NSCLC. (A and B) MLLT10 protein expression levels were detected in A549 and H1944 cells transfected with sh-NC or shMLLT10 with the help of Western blot. (C and D) MLLT10 protein expression levels were detected in A549 cells transfected with LV-NC, LV-anti-miR-331-3p, or LV-anti-miR-331-3p+shMLLT10 with the help of Western blot. (E and F) MLLT10 protein expression levels were detected in H1650 and H1299 cells transfected with LV-NC or LV-MLLT10 with the help of Western blot. (G and H) MLLT10 protein expression levels were detected in H1650 cells transfected with LV-NC, LV-miR-331-3p, or LV-miR-331-3p+LV-MLLT10 with the help of Western blot. GAPDH conducted as the internal control. All quantitative values were the average of three independent experiments. *P<0.05.
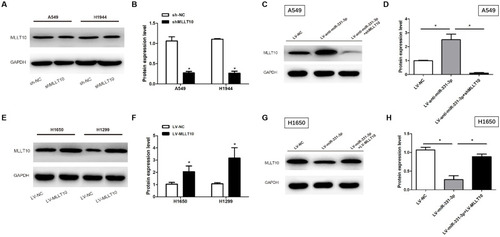
Figure 5 miR-331-3p repressed tumor cell proliferation, metastasis, invasion by targeting MLLT10 in NSCLC. (A) Cell viabilities were detected in A549 cells transfected with LV-NC, LV-anti-miR-331-3p, or LV-anti-miR-331-3p+shMLLT10 from Day1 to Day5 with the help of CCK-8 assay. (B) Cell viabilities were detected in H1650 cells transfected with LV-NC, LV-miR-331-3p, or LV-miR-331-3p+LV-MLLT10 from Day1 to Day5 with the help of CCK-8 assay.(C) The migration and invasion cell numbers of A549 cells transfected with LV-NC, LV-anti-miR-331-3p, or LV-anti-miR-331-3p+shMLLT10 using Transwell assay.(D) The migration and invasion cell numbers of H1650 cells transfected with LV-NC, LV-miR-331-3p, or LV-miR-331-3p+LV-MLLT10 using Transwell assay. All quantitative values were the average of three independent experiments. *P<0.05,**P<0.01.
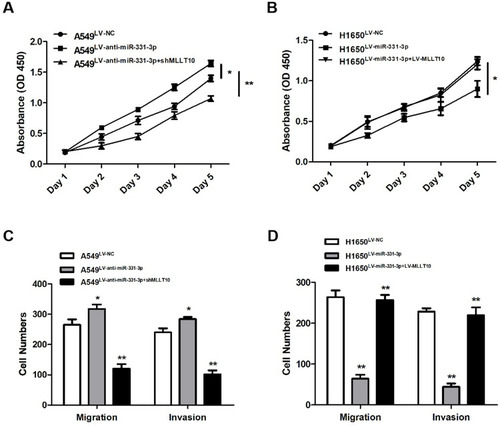
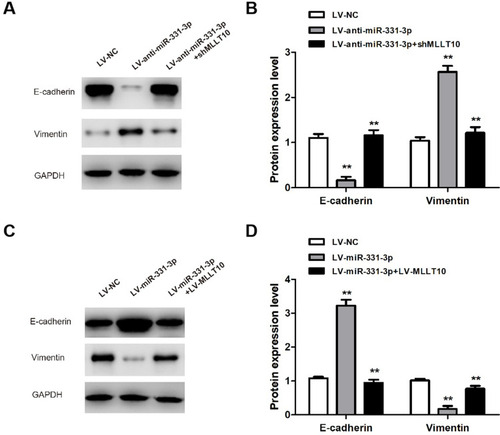
Figure 6 miR-331-3p/MLLT10 axis modulated the expression of E-cadherin and Vimentin in NSCLC. (A and B) E-cadherin and Vimentin expression levels were measured in A549 cells transfected with LV-NC, LV-anti-miR-331-3p, or LV-anti-miR-331-3p+shMLLT10 using Western blot. (C and D) E-cadherin and Vimentin expression levels were measured in H1650 cells transfected with LV-NC, LV-miR-331-3p, or LV-miR-331-3p+LV-MLLT10 using Western blot. GAPDH conducted as the internal control. All quantitative values were the average of three independent experiments. **P<0.01.