Figures & data
Figure 1 GLUT1 expression in GC tissues. (A) Representative immunohistochemistry (IHC) staining of GLUT1 in GC and adjacent normal tissues (scale bar = 100μm, (a) negative (b) weak (c) positive (d) strongly positive). (B-E) Nonparametric t test of IHC scores between (B) normal and tumor tissues, (C) T1-2 and T3-4, (D) no LNM and LNM and (E) TNM I-IIand TNM III-Ⅳ (**P<0.01; ***P<0.001).
Abbreviations: T, tumor grading; LNM, lymph node metastasis; TNM, TNM staging.
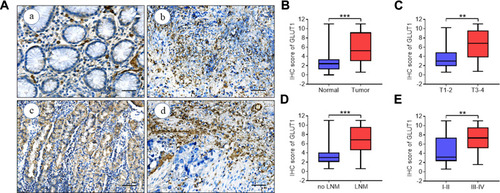
Table 1 Association Between GLUT1 Expression and Clinicopathological Factors in 57 Patients with GC
Figure 2 Kaplan-Meier survival analysis of postoperative GC patients. (A) Overall survival (OS) curves of 57 postoperative patients according to positive or negative GLUT1 expression. OS curves of postoperative patients in subgroups demarcated with lymph node metastasis (B), without lymph node metastasis (C), TNMI-II (D) or TNM III-Ⅳ (E) according to GLUT1 expression.
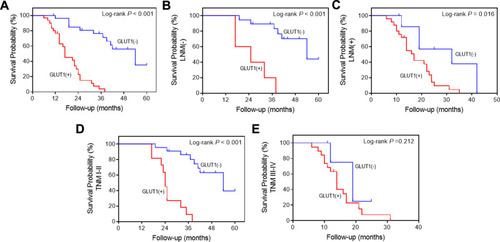
Table 2 Results of Univariate and Multivariate Analyses of Patients’ Survival in Gastric Cancer by Cox’s Proportional Hazard Model
Figure 3 Analysis of the effects on survival of GC patients in subgroups according to GLUT1 expression. Patients were divided into groups by age, gender, tumor size, depth of tumor invasion, lymph node metastasis, degree of differentiation, venous invasion, neural invasion, and TNM staging.
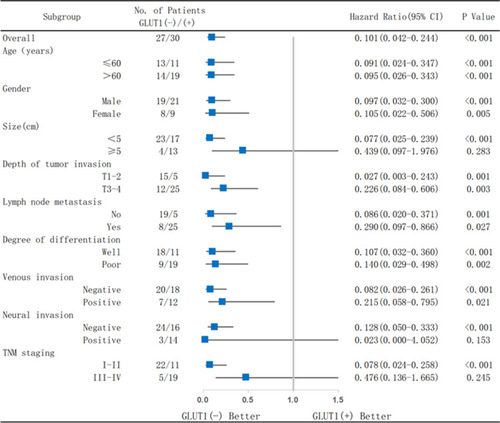
Figure 4 Immunohistochemistry of p-AKT and p-S6K1 correlated with GLUT1 expression in GC tissues. Expression of (A) p-AKT and (D) p-S6K1 were evaluated in gastric cancer (GC) tissues by immunohistochemistry (IHC) (scale bar=100μm). Expression analysis of (C) p-AKT and (F) p-S6K in normal and GC tissues. Proportion analysis of (B) p-AKT (-)/p-AKT (+), (E) p-S6K1 (-)/p-S6K1 (+) in GLUT1 (-)/(+) tissues. (**, P<0.01; ***, P<0.001; —, negative; +, positive).
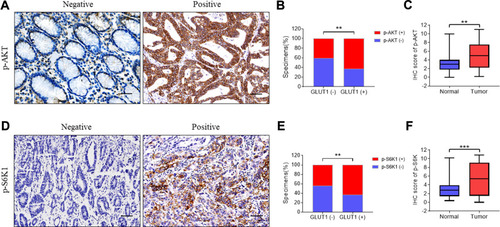
Figure 5 Correlation between GLUT1 and S6K1 expression in gastric cancer tissues. (A) Stratification of 57 pairs gastric cancer (GC) tissues and normal tissues into cluster 1 (RED) and cluster (green) according to GLUT1 and S6K1 immunohistochemistry (IHC) staging scores. (B) The percentage of normal and tumor tissues in each cluster. (C) Correlation analysis of p-S6K1 and GLUT1 IHC score in in GC tissues (p=0.001, R=0.173). (D) OS curves of GC patients according to negative or positive p-S6K1 expression. (E) OS curves of GC patients with GLUT1(+)/p-S6K1(+) or GLUT1(-)/p-S6K1(+) and GLUT1(+)/p-S6K1(-). (F) OS curves of GC patients with p-S6K1(-)/GLUT1(-), p-S6K1(-)/GLUT1(+), p-S6K1(+)/GLUT1(-) and p-S6K1(+)/GLUT1(+). (—, negative; +, positive).
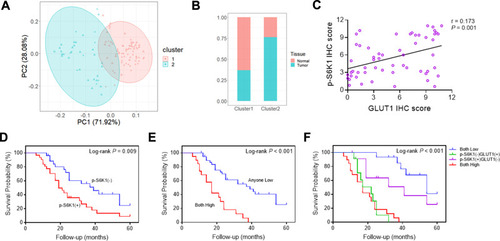
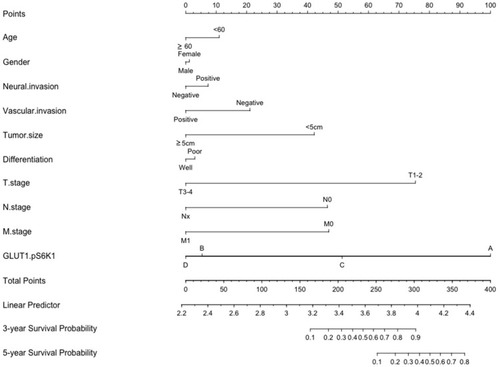
Figure 6 Nomogram for the predication of survival probability of gastric cancer patients. A total of 10 variables were involved, the points of every variable correspond to the scale in the first row. The summary of variable points projected on the TOTAL POINTS scale corresponds to the 3/5-year survival probability scale. (The scale of GLUT1.pS6K1: A= p-S6K1(-)/GLUT1(-); B= GLUT1(+)/p-S6K1(-); C= p-S6K1(+)/GLUT1(-); D= p-S6K1(+)/GLUT1(+)).