Figures & data
Table 1 Clinicopathological Characteristics Before and After PSM
Figure 1 Flow chart of patients’ enrollment from the primary liver cancer big data.
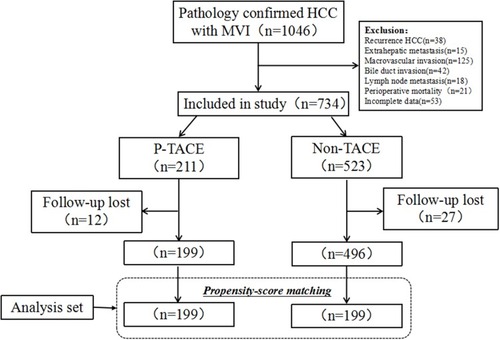
Figure 2 Comparison of disease-free survival (DFS) and overall survival (OS) between the p-TACE and non-TACE groups before and after propensity score matching (PSM). DFS and OS before PSM (A and B). DFS and OS after PSM (C and D).
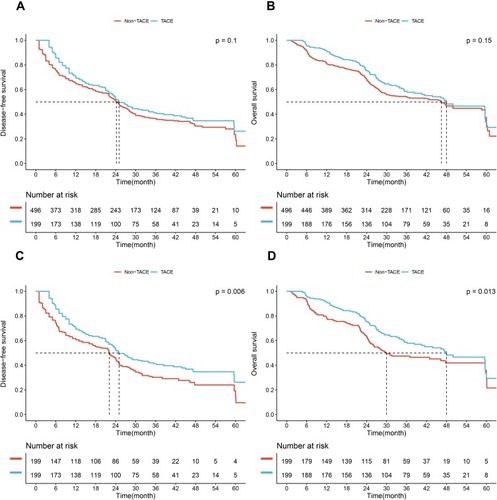
Table 2 Univariate and Multivariate Analysis of Disease-Free Survival and Overall Survival After PSM
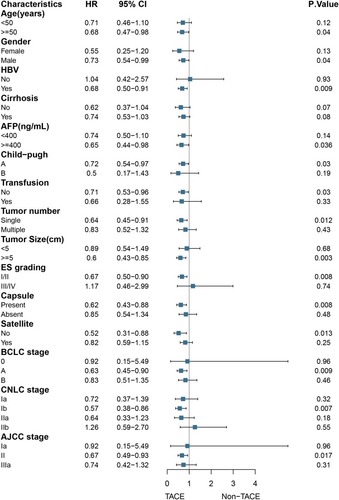
Figure 3 Subgroup analysis of disease-free survival (DFS) stratified by clinicopathological variables related to the prognosis in the matched cohort.
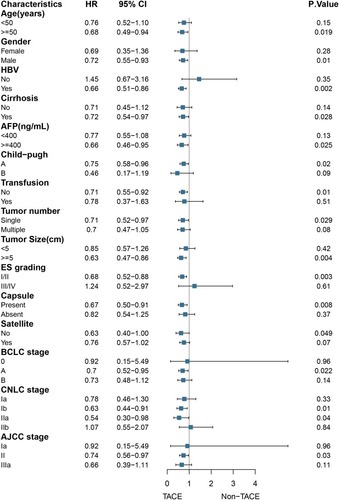
Figure 4 Subgroup analysis of overall survival (OS) stratified by clinicopathological variables related to the prognosis in the matched cohort.