
Figures & data
Figure 1 Representative IHC staining of PME-1 in HCC. Representative images of PME-1 immunohistochemical staining from HCC patient samples used for correlation analysis. (A) Negative, (B) weak, (C) moderate, (D), strong. Scale bars = 50 μm.
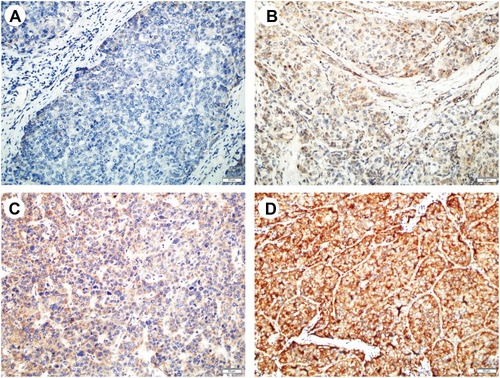
Table 1 Patient Characteristics
Figure 2 Comparison of PME-1 expression between HCC tissues and paired adjacent noncancerous liver tissue. (A) The representative expression patterns of PME-1 in four cases. Scale bars = 50μm. (B) PME-1 protein expression in HCC was significantly higher than that in normal liver tissues (P < 0.0001). (C) PME-1 mRNA expression level was relatively higher in HCC compared with that in normal liver tissues (P < 0.0001). Data were analyzed with 2-related samples Wilcoxon test.
Abbreviations: ANT, adjacent noncancerous tissue; T, cancer tissues.
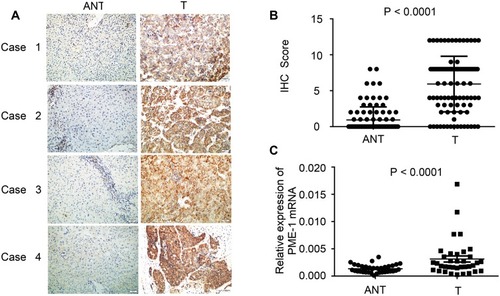
Table 2 Positive Rate of PME-1 Expression among HCC Cancer Tissues and Paired Adjacent Noncancerous Tissues
Table 3 Correlations Between PME-1 Expression and the Clinicopathological Characteristics of Patients with HCC
Figure 3 PME-1 expression was correlated with poor survival. Kaplan–Meier analysis and Log rank test showed that patients with high expression of PME-1 had a shorter survival time than that with low PME-1 expression (P < 0.001).
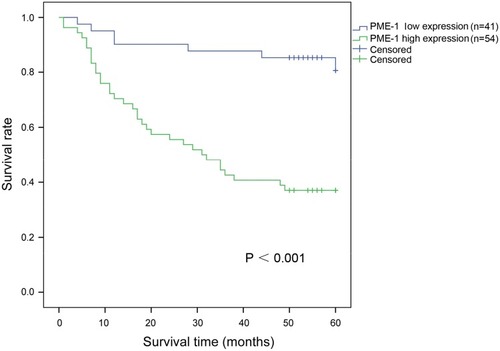
Table 4 Univariate Log Rank Analyses
Table 5 Multivariate Survival Analyses