Figures & data
Figure 1 Targeting EGFR with erlotinib suppressed SACC cell growth and colony formation. (A) The growth of SACC-83 and SACC-LM cells treated with erlotinib was analyzed using a CCK-8 kit; symbols represent the mean values of triplicate tests (mean ± SD). (B) Microphotographs showing colonies from anchorage-independent growth analysis of SACC-83 and SACC-LM cells treated with or without erlotinib (2 µM). The bar graphs indicate the mean (and standard error) number of colonies from four wells, and statistically significant differences are indicated with * (P < 0.01).
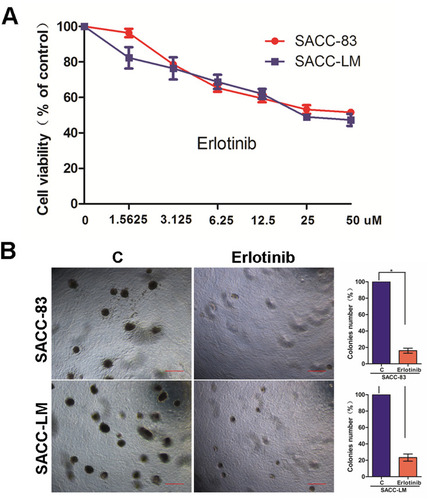
Figure 2 Western blot analysis against p-EGFR, EGFR, cyclin D1, and PCNA expression in SACC cells treated with erlotinib. (A) The protein expression of p-EGFR, EGFR, cyclin D1 and PCNA in SACC-83 cells treated with erlotinib (2uM, 3days) was analyzed by Western blot analysis. (B) The protein expression of p-EGFR, EGFR, cyclin D1 and PCNA in SACC-LM cells treated with erlotinib (2uM, 3days) was analyzed by Western blot analysis.
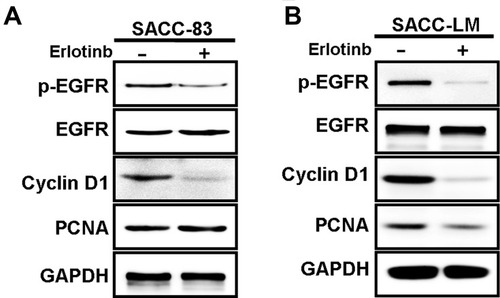
Figure 3 Erlotinib treatment increased the fraction of ALDH+ cells and the sphere-forming ability of SACC cells. (A) SACC-83 and SACC-LM cells were treated with DMSO or 2 µM erlotinib for 3 days and subjected to an ALDEFLUOR assay to detect ALDH+ cells. A portion of the cells was preincubated with the ALDH inhibitor DEAB (+DEAB) to provide a gate (ALDH cells) for flow cytometry. (B) SACC-83 and SACC-LM cells were treated with DMSO or 2 µM erlotinib for 3 days and subjected to a sphere-forming assay. Scale bar= 200 μm. (C) Tumorsphere formation (mean ± SD from 3 separate experiments) was measured in SACC-83 and SACC-LM cells with or without erlotinib treatment. * means p<0.05.
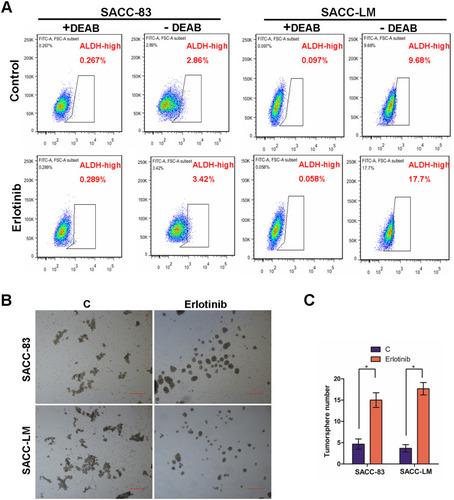
Figure 4 Erlotinib treatment increased the expression cancer stem cell markers. Western blot analyses for Oct4 and Bmi-1 were carried out in SACC-83 and SCC-LM cells treated with or without erlotinib for 3 days.
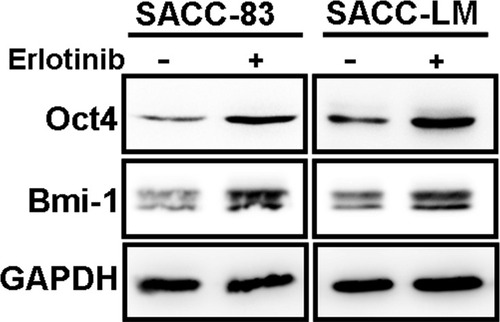
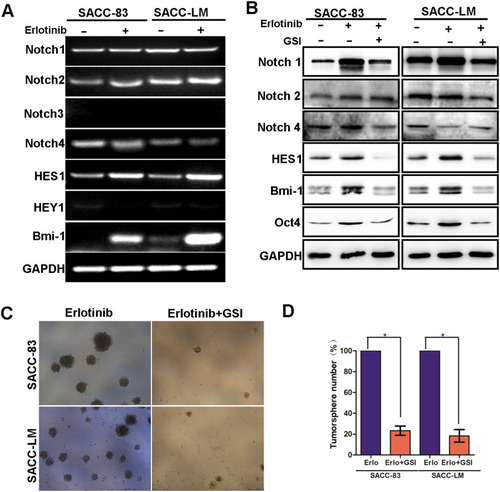
Figure 5 Inhibition of Notch activation with a GSI prevented erlotinib-induced stem cell-like properties in SACC cells. (A) RT-PCR was used to analyze Notch1, Notch2, Notch4, HES1 and Bmi-1 mRNA levels in SACC-83 and SACC-LM cells treated with 2 µM erlotinib for 3 days. (B) Western blotting was used to analyze Notch1, HES1, Bmi-1 and Oct4 protein levels in SACC-83 and SACCLM cells treated with 2 µM erlotinib or a combination of 2 µM erlotinib and a GSI (2 µM). (C) SACC-83 and SACC-LM cells were treated with 2 µM erlotinib or a combination of 2 µM erlotinib and a GSI (2 µM) for 3 days and subjected to a sphere-forming assay. (D) Tumorsphere formation (mean ± SD from 3 separate experiments) was measured in SACC-83 and SACC-LM cells treated with 2 µM erlotinib or a combination of 2 µM erlotinib and a GSI (2 µM) for 3 days. * means p<0.05.