Figures & data
Table 1 Correlation Between lncRNA JPX Expression and Clinicopathological Parameters of NSCLC Patients (n = 45)
Figure 1 JPX induced NSCLC cells proliferation and EMT, and inhibited apoptosis. (A) RT-qPCR assays were carried out to detect JPX expression in NSCLC tumor tissues (n=25) and adjacent normal tissues (n=25). (B) Expression level of JPX in NSCLC cell lines (NCI-H1299, A549, and NCI-H460) and normal human lung cell line (BEAS-2B) were measured by RT-qPCR assays. (C) Knockdown efficiency of si-JPX in NCI-H1299 and A549 cells. (D) CCK-8 analysis of proliferation in transfected NCI-H1299 and A549 cells. (E) Cell colony formation analysis of clone number in transfected NCI-H1299 and A549 cells. (F) Flow cytometry analysis of apoptosis in transfected NCI-H1299 and A549 cells. (G) Transwell analysis of invasion in transfected NCI-H1299 and A549 cells. (H) Wound healing analysis of migratory rate in transfected NCI-H1299 and A549 cells. (I and J) EMT-related protein expressions (E-cadherin, N-cadherin and Vimentin) were detected by Western blot assay in transfected NCI-H1299 and A549 cells. *P <0.05.
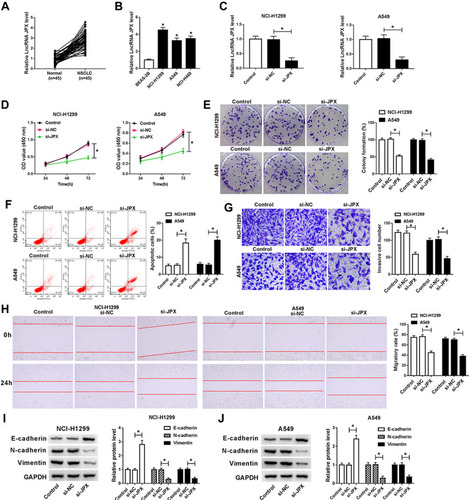
Figure 2 MiR-5195-3p was a direct target of JPX in NSCLC cells. (A) The relative expression of miR-5195-3p was detected by RT-qPCR in NSCLC tissues (n=45) and normal tissues (n=45). (B) Expression correlation between JPX and miR-5195-3p was analyzed with Pearson correlation analysis. (C) miR-5195-3p level in NCI-H1299, A549, NCI-H460, and BEAS-2B cells was tested by RT-qPCR assays. (D) Schematic of a putative target sequence for miR-5195-3p in JPX and mutated miR-5195-3p-binding sites. (E and F) The interactions between JPX and miR-5195-3p were confirmed by luciferase activity analysis. (G and H) The binding between miR-5195-3p and JPX was tested by RIP assay (I) RNA pull-down assay proved the physical interactions between JPX and miR-5195-3p. (J) The effect of JPX on miR-5195-3p level was detected by RT-qPCR assay. *P <0.05.
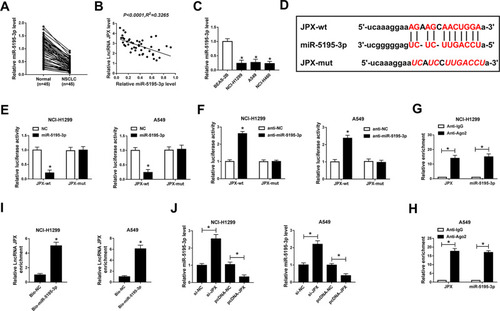
Figure 3 MiR-5195-3p partially reversed the effect of JPX on proliferation, apoptosis and EMT of NSCLC cells in vitro. (A) Expression level of miR-5195-3p was detected by RT-qPCR assay in NCI-H1299 and A549 cells transfected with si-NC, si-JPX, si-JPX + anti-NC and si-JPX + anti-miR-5195-3p. (B) Proliferation was measured by CCK-8 assay in transfected NCI-H1299 and A549 cells. (C) Clone number was calculated by cell colony formation assay in transfected NCI-H1299 and A549 cells. (D) Apoptosis rates were detected by flow cytometry assay in transfected NCI-H1299 and A549 cells. (E and F) The capacities of invasion and migration were determined by transwell and wound healing assays. (G and H) E-cadherin, N-cadherin and Vimentin protein levels were detected by Western blot assay in transfected NCI-H1299 and A549 cells. *P < 0.05.
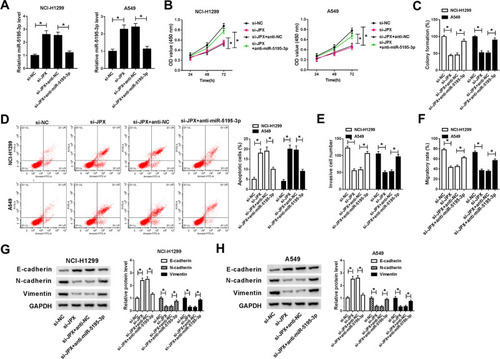
Figure 4 VEGFA as a target of miR-5195-3p. (A) Expression level of VEGFA was detected by RT-qPCR in NSCLC tissues and normal tissues. (B) Expression association between miR-5195-3p and VEGFA was analyzed by using Pearson correlation analysis. (C) RT-qPCR assay was implemented to detect the expression of VEGFA in NSCLC cell lines (NCI-H1299, A549, and NCI-H460) and normal human lung cell line (BEAS-2B). (D) Western blot assay was employed to test the expression of VEGFA in NSCLC cell lines (NCI-H1299, A549) and normal human lung cell line (BEAS-2B). (E) The binding position of miR-5195-3p and VEGFA was predicted by using starBase. (F) Interaction between miR-5195-3p and VEGFA were determined by dual-luciferase reporter assay. (G and H) RIP and RNA-IP assays were enforced in NCI-H1299 and A549 cells to determine the binding condition between miR-5195-3p and VEGFA. (I) Correlation between JPX and VEGFA was analyzed with Pearson. (J) VEGFA protein level was determined in pcDNA-JPX or si-JPX-transfected NCI-H1299 and A549 cells by Western blot assay. (K) Expression level of VEGFA was measured by Western blot assay in NCI-H1299 and A549 cells transfected with NC, miR-5195-3p, miR-5195-3p + pcDNA-NC and miR-5195-3p + pcDNA-JPX. *P <0.05.
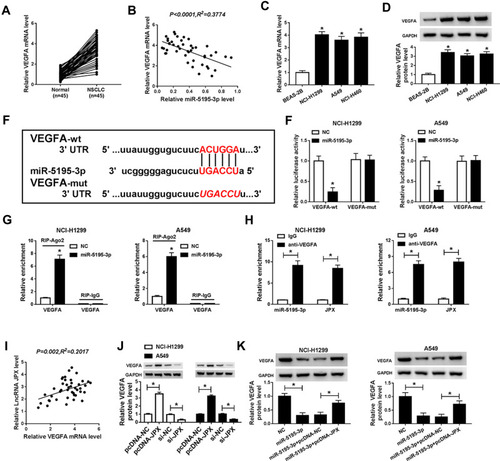
Figure 5 MiR-5195-3p-mediated proliferation, apoptosis and EMT of NSCLC cells were partly abrogated by targeting VEGFA in vitro. (A) Western blot assay was carried out to assess the expression level of VEGFA in NCI-H1299 and A549 cells transfected with NC, miR-5195-3p, miR-5195-3p + vector and miR-5195-3p + VEGFA. (B) CCK-8 analysis of proliferation in transfected NCI-H1299 and A549 cells. (C) Cell colony formation assay was used to detect cell number in transfected NCI-H1299 and A549 cells. (D) Flow cytometry analysis of apoptotic rate in transfected NCI-H1299 and A549 cells. (E and F) Transwell and wound healing assays were applied to assess invasion and migration in transfected NCI-H1299 and A549 cells. (G and H) Western blot assay was performed to determine E-cadherin, N-cadherin and Vimentin in transfected NCI-H1299 and A549 cells. *P <0.05.
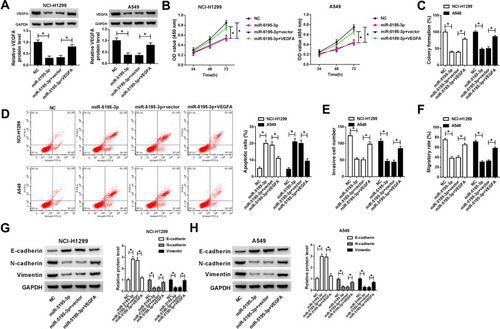
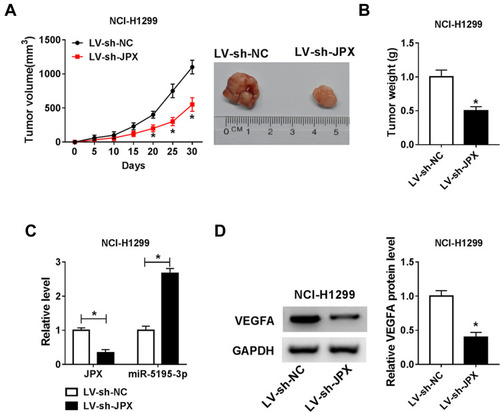
Figure 6 JPX knockdown repressed NSCLC cell growth in vivo. NCI-H1299 cells introduced with LV-sh-NC or LV-sh-JPX were inoculated subcutaneously into the nude mice. (A) Growth curve of xenografted tumors once every 5 days. (B) Weights of resected tumor masses. (C) Expression levels of JPX and miR-5195-3p were determined in xenografted tumors by RT-qPCR assay. (D) VEGFA protein level was detected in xenografted tumors by Western blot assay. *P <0.05.