
Figures & data
Figure 1 An illustrative case of 61-year-old man who went DEB-TACE treatment. (A) Contrast-enhanced CT showed a tumor with weak enhancement near the hepatic hilar region. (B) DSA showed that faint tumor staining before treatment. (C) After DEB-TACE treatment, the tumor staining and obvious tumor nodule disappeared on DSA. (D) One month after treatment, enhanced CT revealed that tumor density decreased and necrosis occurred. (E) Three months after treatment, tumor shrunk and no recurrence or intrahepatic metastasis occurred.
Abbreviations: DEB-TACE, drug-eluting beads transarterial chemoembolization; CT, computed tomography; DSA, digital subtraction angiography.
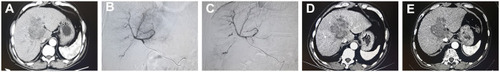
Table 1 Baseline Data of Patients in the Study
Table 2 Assessment of Tumor Response Between Two Treatment Groups
Table 3 The Comparison of Adverse Events Between Two Treatment Groups
Figure 2 Kaplan-Meier curves of PFS for DEB-TACE and C-TACE groups.
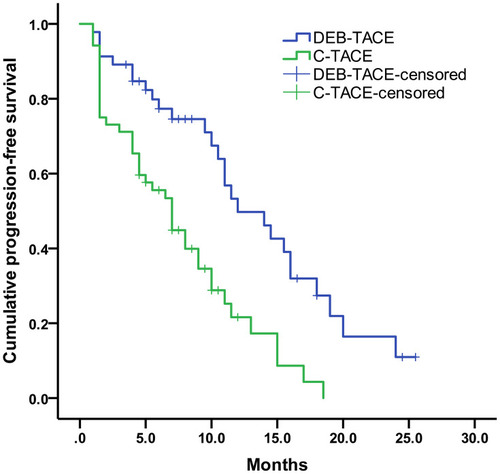
Figure 3 Kaplan-Meier curves of OS for DEB-TACE and C-TACE groups.
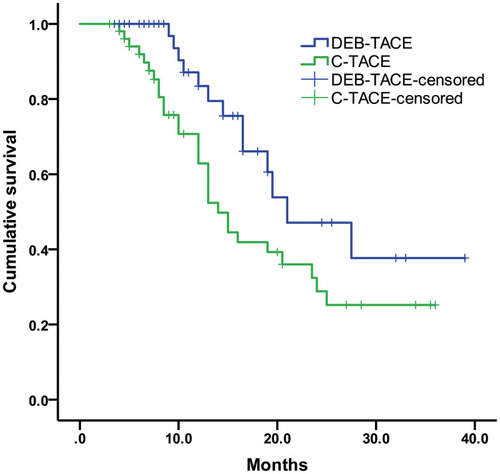
Table 4 Univariate and Multivariate Analysis of Prognostic Factors Affecting PFS and OS