Figures & data
Figure 1 Hsa_circ_0055478 (circPTCD3) is upregulated in breast cancer specimens and cell lines. (A) Hsa_circ_0055478 also named as circPTCD3 was back-spliced by exons 3–9 of PTCD3 gene as the black arrow showed. The existence of circPTCD3 were confirmed by sanger sequencing, the red arrow shows the head-to-tail splicing junction site of circPTCD3. (B) After treatment with Actinomycin D, the amount of circular and linear PTCD3 from breast cancer cells were evaluated using qPCR. (C) FISH assay with specific probe was performed to detect the expression and location of circPTCD3. (D) After RNase R treatment, the expression of linear and circular PTCD3 were detected using qPCR. Expression level of circPTCD3 was evaluated by qPCR in breast cancer tissues (E) and cell lines (F) compare to the adjacent normal tissues and MCF-10A cell. n=6, *P< 0.05, compared with the normal, mock, MCF-10A group correspondingly, **P< 0.01, compared with the normal.
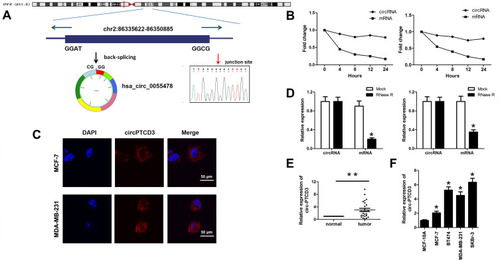
Figure 2 CircPTCD3 promoted the proliferation and migration of breast cancer cell. Breast cancer cells were transfected with overexpressing vector or siRNA for circPTCD3 as well as their negative control respectively. (A) qPCR was used to evaluate the expression level of circPTCD3. (B) MTT was performed to detect the proliferation of breast cancer cells in MCF-7 and MDA-MB-231. (C) Wound healing assay was carried out to evaluate the migration of breast cancer cells. (D) Transwell assay was used to investigate the migration of the breast cancer cell. (E) Colony formation assay was performed to evaluate the colony formation ability of breast cancer cell. n=6, *P< 0.05, compared with the si-nc group. #P< 0.05, compared with the vector group.
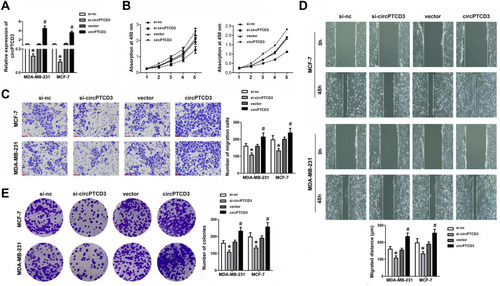
Figure 3 CircPTCD3 directly targets miR-198 in breast cancer cells. (A) The seed sequence of circPTCD3 that binds to miR-198 was showed, the sequences mutated were marked in red. (B) Luciferase reporter assay was carried out in breast cancer cell transfected with miR-198 mimic and the mimic control along with the reporter vector containing wild or mutant type of binding sequence of circPTCD3. (C) The level of miR-198 after different treatment was evaluated using qPCR. (D and E) RNA pull down was carried out using specific probe for circPTCD3 ormiR-198 respectively labeled by biotin. (F) Pearson analysis was performed to investigate the correlation between circPTCD3 and miR-198. n=6, *P< 0.05, compared with the biotin-nc, control probe, si-nc and control+wt group. #P < 0.05, compared with the vector group.
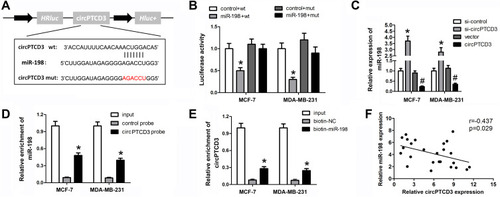
Figure 4 CircPTCD3 reversed the anticancer effect of miR-198 in breast cancer cell. (A) qPCR was used to detect the level of miR-198 in breast cancer cells under different treatment. (B) MTT was performed to evaluate the cell proliferation of breast cancer cells. (C) Transwell assay was used to detect the cell migration of breast cancer cells. (D) Colony formation assay was carried out to investigate the colony formation ability of breast cancer cells. n=6, *P< 0.05, compared with the normal group. #P< 0.05, compared with the miR-198 group.
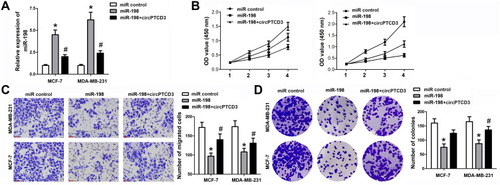
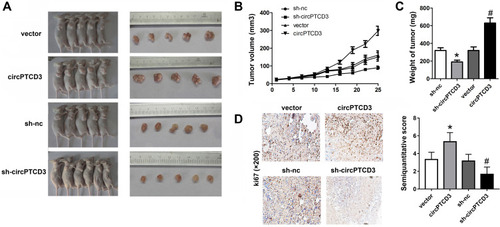
Figure 5 CircPTCD3 promoted the growth of breast cancer cells in vivo. Xenograft tumor model was established by subcutaneously injecting MCF-7 cells stably expressing sh-circPTCD3 or negative control in the dorsal flank area of nude mice. (A) The picture of the nude mice and the tumors in each group. (B) The growth curve of the tumor in the different groups. (C) The weight of the tumors in each group were calculated. (D) IHC was used to detect the ki67 expression (×100). n=5, *P< 0.05, compared with the biotin-nc, #P< 0.05, compared with the vector group.