Figures & data
Figure 1 Elevated long intergenic non-protein coding RNA 1094 (LINC01094) expression in glioblastoma (GBM) tissues and cell lines (A) The Gene Expression Profiling Interactive Analysis database was used to analyze the expression of LINC01094 in glioma tissues (n = 163) and normal brain tissues (n = 207). (B) LINC01094 expression was evaluated in 51 GBM tissues and 14 normal brain tissues based on quantitative reverse transcription polymerase chain reaction (RT-qPCR). (C) LINC01094 expression in five GBM cell lines (U251, SHG-44, U138, LN-229, and T98) versus normal human astrocytes was evaluated and compared using RT-qPCR. (D) The Gene Expression Profiling Interactive Analysis database was used to analyze the association between LINC01094 expression and overall survival in patients with glioma. (E) Kaplan–Meier analysis was performed to evaluate the correlation between LINC01094 expression and overall survival in patients with GBM (P = 0.7835). **P < 0.01.
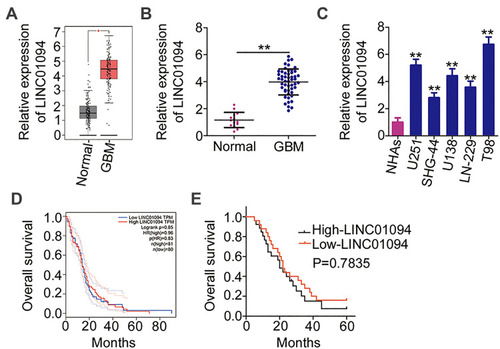
Table 1 Association Between Long Intergenic Non-Coding RNA 1094 (LINC01094) and Clinicopathological Parameters in Patients with GBM
Figure 2 Long intergenic non-protein coding RNA 1094 (LINC01094) depletion inhibits the proliferation, migration, and invasion and promotes the apoptosis of U251 and T98 glioblastoma cell lines in vitro. (A) Quantitative reverse transcription polymerase chain reaction (RT-qPCR) was performed to assess the efficiency of transfection with small interfering RNAs specific for LINC01094 (si-LINC01094) or negative control (NC) siRNA (si-NC). (B) Cell Counting Kit-8 assay was performed to analyze the proliferative abilities of U251 and T98 cells after LINC01094 knockdown. (C) Flow cytometry was performed to evaluate the frequency of apoptosis in si-LINC01094-transfected or si-NC-transfected U251 and T98 cells. (D, E) U251 and T98 cells were subjected to migration and invasion assays after transfection with si-LINC01094 or si-NC. *P < 0.05 and **P < 0.01.
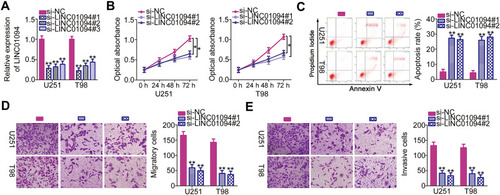
Figure 3 Long intergenic non-protein coding RNA 1094 (LINC01094) acts as a molecular sponge for microRNA (miR)-577 in glioblastoma (GBM) cells. (A) Subcellular fractionation was performed to test the localization of LINC01094 expression in U251 and T98 cells. (B) Bioinformatics prediction analysis predicted the site of binding between wild-type LINC01094 and miR-577. The mutant binding sequences are also shown. Hsa represents the meaning of human. (C) miR-577 expression in U251 and T98 cells transfected with si-LINC01094 or si-NC was detected by quantitative reverse transcription polymerase chain reaction (RT-qPCR). (D) miR-577 expression was detected in 51 GBM tissues and 14 normal brain tissues using RT-qPCR. (E) Pearson’s correlation coefficient analysis was performed to determine the association between LINC01094 and miR-577 expressions in 51 GBM tissues (r = −0.5247, P < 0.0001). (F) The efficiency of miR-577 mimic in U251 and T98 cells was quantified using RT-qPCR. (G) U251 and T98 cells were cotransfected with miR-577 mimic or negative control miRNA mimics (miR-NC) and plasmids encoding wild-type (LINC01094-wt) or mutant LINC01094 (LINC01094-mut). After 48-h culture, luciferase activity in the cells was analyzed using the Dual-Luciferase Reporter Assay System. (H) RNA immunoprecipitation assay was performed to verify the interaction between LINC01094 and miR-577 in U251 and T98 cells. **P < 0.01.
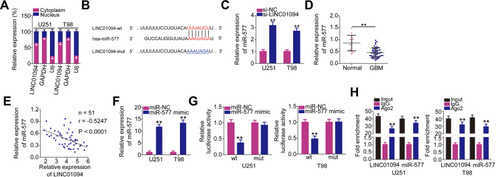
Figure 4 Long intergenic non-protein coding RNA 1094 (LINC01094) regulates brain-derived neurotrophic factor (BDNF) expression in U251 and T98 cells by sponging microRNA (miR)-577. (A) The wild-type miR-577 binding site in the 3′-untranslated region of BDNF, as predicted by bioinformatics prediction analysis. Hsa represents the meaning of human. (B) Luciferase activity was measured in U251 and T98 cells after cotransfection with miR-577 mimic or negative control miRNA mimics (miR-NC) and luciferase reporter plasmids encoding wild-type (BDNF-wt) or mutant BDNF (BDNF-mut). (C, D) Detection of BDNF mRNA and protein levels by quantitative reverse transcription polymerase chain reaction (RT-qPCR) and Western blotting, respectively, in miR-577 overexpressing-U251 and T98 cells. (E) BDNF mRNA expression in 51 GBM tissues and 14 normal brain tissues was evaluated using RT-qPCR. (F) Pearson’s correlation coefficient analysis was performed to assess the correlation between miR-577 and BDNF mRNA expressions in 51 GBM tissues (r = −0.5926, P < 0.0001). (G, H) RT-qPCR and Western blotting were performed to measure BDNF mRNA and protein expression levels in LINC01094-deficient U251 and T98 cells. (I) Pearson’s correlation coefficient analysis was performed to detect a positive relationship between LINC01094 and BDNF mRNA expression levels in the 51 GBM tissues (r = 0.5803, P < 0.0001). (J) U251 and T98 cells were treated with miR-577 or negative control (NC) inhibitor. Transfection efficiency was assessed using RT-qPCR. (K, L) U251 and T98 cells were treated simultaneously with small interfering RNA specific for LINC01094 (si-LINC01094) and either miR-577 inhibitor or NC inhibitor. BDNF mRNA and protein expression levels were respectively analyzed using RT-qPCR and Western blotting, respectively. **P < 0.01.
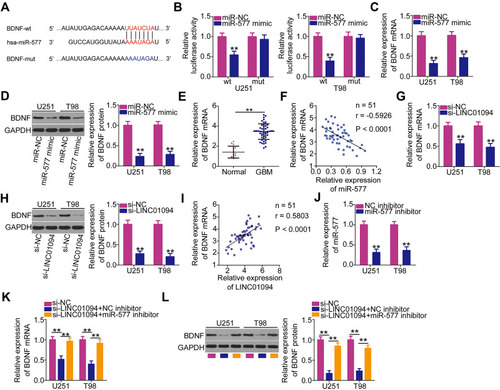
Figure 5 Inhibition of microRNA (miR)-577 or reintroduction of brain-derived neurotropic factor (BDNF) reverses the inhibited malignant characteristics of long intergenic non-protein coding RNA 1094 (LINC01094)-deficient glioblastoma (GBM) cells. (A) U251 and T98 GBM cells transfected with small interfering RNA specific for LINC01094 (si-LINC01094) in the presence of miR-577 inhibitor or negative control (NC) inhibitor were subjected to Cell Counting Kit (CCK)-8 assay to evaluate cell proliferation. (B) Flow cytometry analysis was utilized to determine the apoptosis of U251 and T98 cells that were treated as above described. (C, D) Migration and invasion assays were carried out to assess the migratory (C) and invasive (D) capacities of aforementioned cells. (E) BDNF protein expression levels in U251 and T98 cells transfected with plasmid encoding BDNF (pcDNA3.1-BDNF) or empty vector (pcDNA3.1) were detected by Western blotting. (F) U251 and T98 cells were cotransfected with si-LINC01094 and pcDNA3.1-BDNF or pcDNA3.1. The proliferation of transfected cells was detected by CCK-8 assay. (G) Flow cytometry analysis was employed in determining the apoptosis of U251 and T98 cells that were cotransfected with si-LINC01094 and pcDNA3.1-BDNF or pcDNA3.1. (H, I) Migration and invasion assays were used to analyze the migration (H) and invasion (I) of U251 and T98 cells after cotransfection with si-LINC01094 and pcDNA3.1-BDNF or pcDNA3.1. *P < 0.05 and **P < 0.01.
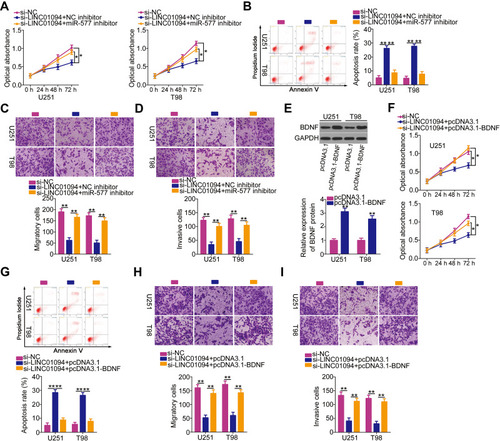
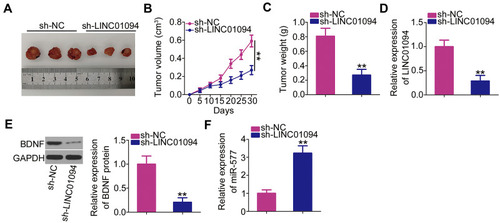
Figure 6 Depletion of long intergenic non-protein coding RNA 1094 (LINC01094) inhibits glioblastoma xenograft growth in vivo. (A) Tumor xenografts were excised on day 30 after cell injection and photographed. (B) Tumor volumes were monitored every 5 days after cell injection, as shown in the corresponding growth curves. (C) The weights of the xenograft tumors were measured 30 days after cell injection. (D–F) The expression levels of LINC01094, BDNF protein, and microRNA-577 in the xenograft tumors. **P < 0.01.