Figures & data
Figure 1 Identification of KLF16 as a potential oncogene in breast cancer. (A) Heatmap showing the expression levels of KLF family members in normal breast tissues and cancer tissues in the TCGA BRCA dataset (normal, n=114; tumor, n=1086; t-test, p<0.001). (B) Survival plots showing disease-free survival (DFS) of breast cancer patients according to the expression levels of KLF16, KLF1, KLF7, and KLF13 (low, n=227; high, n=227; Log rank test). Data were acquired from the TCGA BRCA dataset and Quantile cut-off values were used to analyze disease-free survival. (C) Association between KLF16 (226328_at) expression levels and PPS of breast cancer patients (low, n=170; high, n=164; Log rank test). HR, hazard ratio; PPS, post-progression survival. (D) KLF16 mRNA expression levels in normal breast and tumor tissues (normal, n=114; tumor, n=1086; t-test). (E) KLF16 mRNA expression in different breast cancer molecular subtypes (normal, n=114; luminal, n=660; HER2-enriched, n=38; TNBC, n=177; t-test). (F) KLF16 mRNA expression in patients of different ages (≤45, n=27; >45, n=908; t-test).
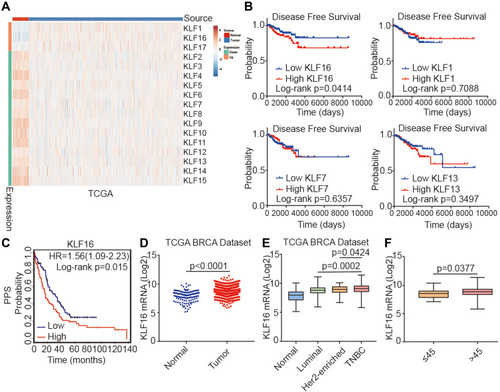
Table 1 Association Between KLF16 Expression and Clinicopathological Parameters in Breast Cancer Tissues (n=117)
Figure 2 KLF16 protein levels are elevated in human breast cancer specimens. (A) Representative IHC staining images of human breast tissues with low, medium, and high KLF16 protein levels. Scalebar = 50μm. (B) IHC score of KLF16 expression in adjacent non-tumor and tumor tissues (normal, n=65; tumor, n=117). (C) IHC score of KLF16 expression in different molecular subtypes of breast cancer (normal, n=65; luminal, n=33; HER2-enriched, n=29; TNBC, n=55). (D) IHC score of KLF16 expression in different histological grade tumors (II, n=46; III, n=71). (E) Breast cancer disease-free survival was analyzed using the Log rank test according to the KLF16 expression levels (low, n=48; high, n=69). Each bar represents the mean ± SD (Mann–Whitney test).
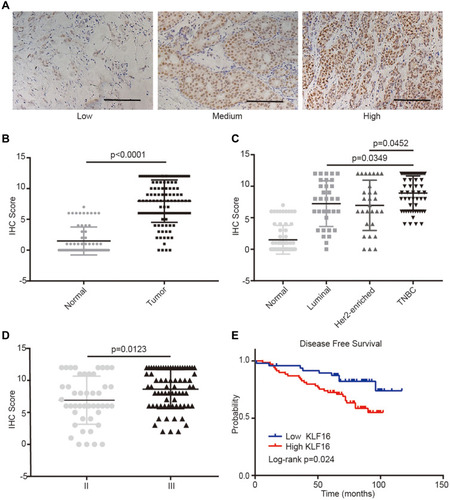
Figure 3 KLF16 silencing inhibited breast cancer cell proliferation in vitro and in vivo. MCF-7 and MDA-MB-231 cells were transfected with two different KLF16-targeting shRNAs or control shRNA (shSCR). (A) The knockdown efficiency was confirmed with Western blotting. β-Actin was chosen as an internal control in Western blotting. (B) CCK-8 assay was used to assess the viability of each cell group at the indicated time points. (C) Colony formation assay in MCF-7 and MDA-MB-231 cells expressing the indicated shRNAs. (D) The numbers of colonies in each group were counted. Each value represents the mean ± standard deviation of three independent experiments in (B and D); ***p<0.001. (E) The images of xenografts are shown. (F) The final tumor volumes are shown. (G) The tumor weights are shown. Bars in F and G represent mean ± standard deviation (Mann–Whitney, **p <0.01, n=5).
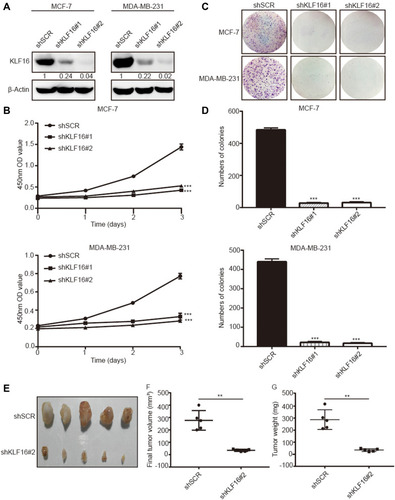
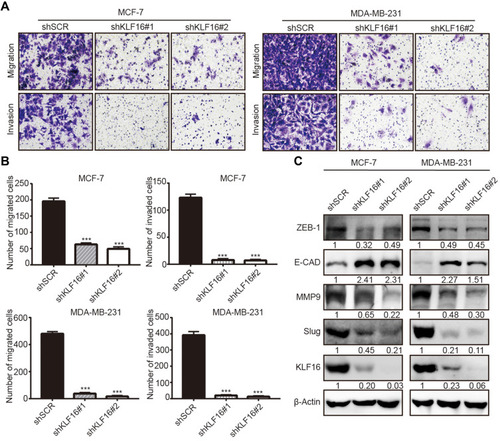
Figure 4 KLF16 silencing impairs migration and invasion and suppresses EMT in breast cancer cells. (A) MCF7 and MDA-MB-231 cells expressing KLF16-targeting shRNAs or control shRNA were used for transwell migration and invasion assays. Representative images after 0.1% crystal violet staining are shown. (B) The quantitative results of migration and invasion for each group are shown; Bar graphs represent mean ± standard deviation of three independent experiments (t-test, *** p<0.001). (C) The protein levels of ZEB1, E-cadherin, MMP9, Slug, and KLF16 were assessed by Western blotting. β-Actin was used as the internal control in Western blotting analysis.