Figures & data
Table 1 Clinicopathological Features of Prostate Cancer Patients
Table 2 Primers in qRT-PCR Assay
Figure 1 Circ-ZNF609 is highly expressed in PCa. (A) The level of circ-ZNF609 was examined in PCa tissues and matching non-tumor tissues by qRT-PCR. (B) qRT-PCR was applied to detect the level of circ-ZNF609 in normal human prostate epithelial cell line and a panel of four PCa cell lines. *P<0.05.
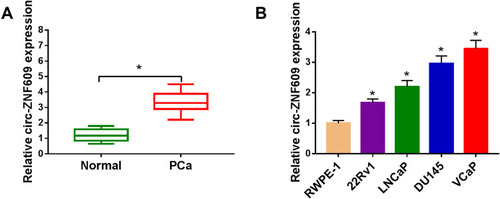
Figure 2 Circ-ZNF609 silencing inhibits the progression and radioresistance of PCa in vitro. (A–K) DU145 and VCaP cells were transfected with 300 nM si-NC or si-circ-ZNF609, respectively. (A) The relative expression of circ-ZNF609 was detected in PCa cells by qRT-PCR after transfection for 48 h. (B and C) The viability of PCa cells was analyzed by MTT assay after transfection for 72 h. (D) Flow cytometry was used to detect the apoptosis rate of PCa cells in Control group, si-NC transfected group and si-circ-ZNF609 transfected group after transfection for 72 h. (E and F) Transwell assays were conducted to assess the migration and invasion abilities of PCa cells in Control, si-NC and si-circ-ZNF609 groups after transfection for 24 h. (G and H) Colony formation assay was used to evaluate the radioresistance of PCa cells in different groups with increased doses of irradiation (2 Gy, 4 Gy, 6 Gy and 8 Gy). (I and J) Fluorescence-based glucose and lactate assay kits were used to detect the glycolytic metabolism rate of PCa cells. (K) The level of circ-ZNF609 was examined in DU145 and VCaP cells transfected with 1 µg pcDNA or circ-ZNF609 plasmid by qRT-PCR. (L and M) DU145 and VCaP cells were treated with pcDNA, circ-ZNF609, circ-ZNF609 + DMSO or circ-ZNF609 + 2-DG. The radioresistance of PCa cells was assessed by colony formation assay. *P<0.05.
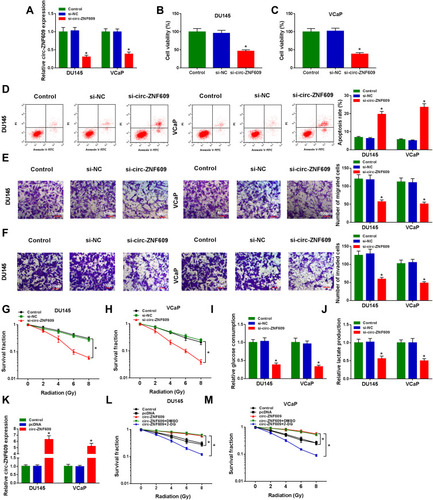
Figure 3 Circ-ZNF609 directly interacts with miR-501-3p. (A) The potential binding region with miR-501-3p in circ-ZNF609 (predicted by StarBase software) and the mutant form of circ-ZNF609 were shown. (B and C) The target interaction between circ-ZNF609 and miR-501-3p was analyzed by dual-luciferase reporter assay. (D and E) RIP assay was used to test whether miR-501-3p could bind to circ-ZNF609 in PCa cells. (F and G) The expression of miR-501-3p was examined in PCa tissues and cells along with adjacent normal tissues and RWPE-1 cells by qRT-PCR. (H) Spearman correlation coefficient was used to analyze the correlation between the expression of miR-501-3p and circ-ZNF609 in PCa tissues. *P<0.05.
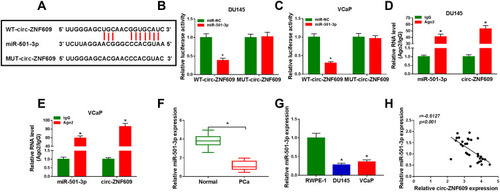
Figure 4 Circ-ZNF609 modulates the malignant potential of PCa cells through sponging miR-501-3p. (A–J) DU145 and VCaP cells were transfected with si-NC (300 nM), si-circ-ZNF609 (300 nM), si-circ-ZNF609 (300 nM) + anti-miR-NC (400 nM) or si-circ-ZNF609 (300 nM) + anti-miR-501-3p (400 nM). (A) The expression of miR-501-3p was detected in PCa cells by qRT-PCR after transfection for 48 h. (B and C) Cell viability of PCa cells was analyzed using MTT assay after transfection for 72 h. (D) Flow cytometry was used to analyze the apoptosis rate of transfected PCa cells after transfection for 72 h. (E and F) The migration and invasion capacities of PCa cells were analyzed through transwell assays after transfection for 24 h. (G and H) The radioresistance of PCa cells was assessed through measuring survival fraction using colony formation assay. (I and J) The influence of circ-ZNF609 and miR-501-3p in the glycolysis of PCa cells was evaluated using fluorescence-based glucose and lactate assay kits. (K and L) PCa cells were treated with anti-miR-NC, anti-miR-501-3p or anti-miR-501-3p + 2-DG, and colony formation assay was used to analyze the radioresistance of DU145 and VCaP cells with various doses of irradiation. *P<0.05.
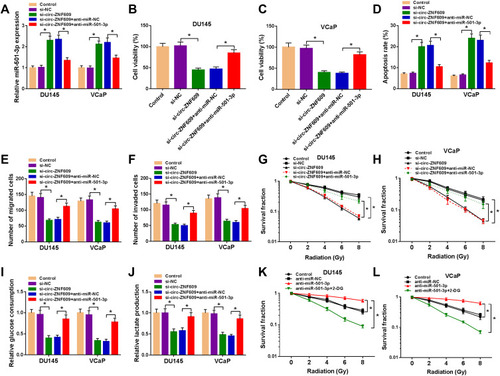
Figure 5 HK2 is a direct target of miR-501-3p. (A) The binding region between HK2 and miR-501-3p was predicted by StarBase dataset. The mutant-type of HK2 sequence was also shown. (B and C) The target interaction between miR-501-3p and HK2 was measured by dual-luciferase reporter assay. (D and E) RIP assay was utilized to assess the combination between miR-501-3p and HK2. (F and G) The mRNA and protein levels of HK2 were detected by qRT-PCR and Western blot assay. (H) The linear relationship between the expression of miR-501-3p and HK2 was analyzed by Spearman correlation coefficient. (I and J) qRT-PCR and Western blot assay were used to detect the mRNA and protein expression of HK2 in PCa cells and RWPE-1 cells. *P<0.05.
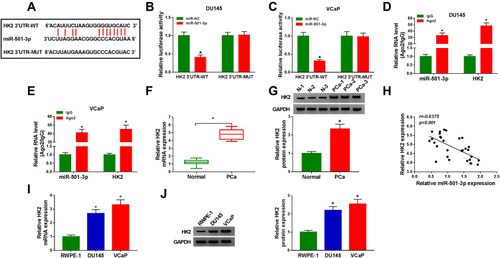
Figure 6 MiR-501-3p functions through targeting HK2 in PCa. (A–J) DU145 and VCaP cells were transfected with miR-NC (400 nM), miR-501-3p (400 nM), miR-501-3p (400 nM) + pcDNA (1 µg) or miR-501-3p (400 nM) + HK2 (1 µg). (A) The protein level of HK2 was examined in PCa cells by Western blot assay after transfection for 48 h. (B and C) MTT assay was used to examine the cell viability of PCa cells after transfection for 72 h. (D) The apoptosis of transfected PCa cells was assessed by flow cytometry after transfection for 72 h. (E and F) The migration and invasion of PCa cells were analyzed by Transwell assays after transfection for 24 h. (G and H) Colony formation assay was used to assess the radioresistance of PCa cells. (I and J) The glucose consumption and lactate production were measured to analyze the glycolysis of PCa cells with fluorescence-based glucose and lactate assay kits. (K and L) DU145 and VCaP cells were treated with pcDNA, HK2 plasmid or HK2 plasmid and 2-DG. Colony formation assay was used to analyze the radioresistance of PCa cells. *P<0.05.
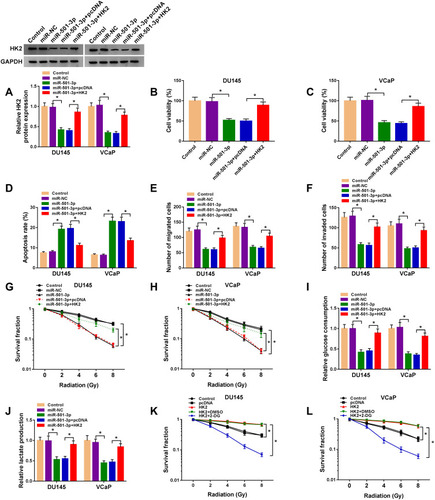
Figure 7 Circ-ZNF609 up-regulates HK2 through targeting miR-501-3p. (A and B) DU145 and VCaP cells were transfected with si-NC (300 nM), si-circ-ZNF609 (300 nM), si-circ-ZNF609 (300 nM) + anti-miR-NC (400 nM) or si-circ-ZNF609 (300 nM) + anti-miR-501-3p (400 nM). The expression of HK2 was analyzed by Western blot assay after transfection for 48 h. *P<0.05.
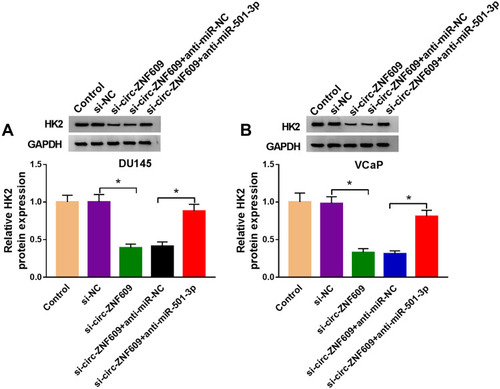
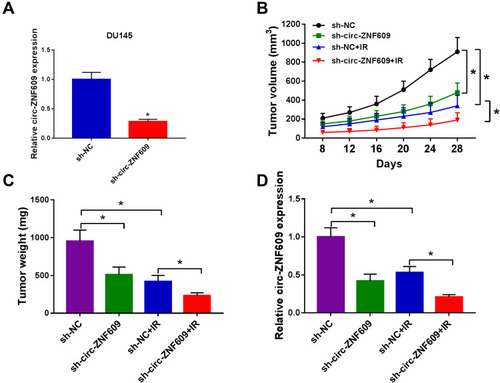
Figure 8 Circ-ZNF609 silencing elevates radiosensitivity of PCa in vivo. (A) qRT-PCR was implemented to measure the expression of circ-ZNF609 in DU145 cell line stably transfected with sh-NC or sh-circ-ZNF609. (B) Tumor volume in sh-NC group, sh-circ-ZNF609 group, sh-NC + IR group and sh-circ-ZNF609 + IR group was measured every 4 d after 8-d injection. (C) Tumors in different groups were resected and weighed after 28-d injection. (D) The expression of circ-ZNF609 was detected in different groups by qRT-PCR. *P<0.05.