Figures & data
Figure 1 The expression of TATDN1 and miR-26b were altered in TNBC. The differential expression of TATDN1 (A) and miR-26b (B) in TNBC were analyzed by measuring their expression levels in both TNBC and non-tumor tissues from the 66 TNBC patients. Data were compared by performing paired t-test. All PCR reactions were repeated 3 times. ***p < 0.001.
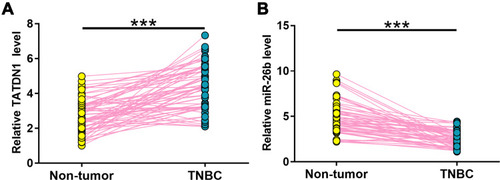
Figure 2 The expression of TATDN1 and miR-26b were inversely correlated. The correlations between the expression of TATDN1 and miR-26b across TNBC (A) and non-tumor (B) tissues from the 66 patients were analyzed by Pearson’s correlation coefficient.
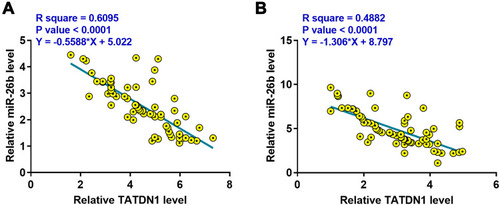
Figure 3 TATDN1 negatively regulated the expression of miR-26b in BT-549 cells. BT-549 cells were transfected with TATDN1 expression vector and siRNA as well as miR-26b mimic. Transfections were confirmed by qPCR at 24 h post-transfection (A). The effects of overexpression and silencing of TATDN1 on miR-26b (B), and the effects of overexpression of miR-26b on TATDN1 (C) were all analyzed by qPCR at 24 h post-transfection. All PCR reactions were repeated 3 times, and mean values were presented. *p < 0.05.
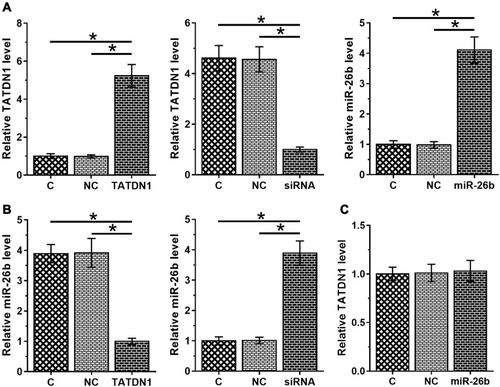
Figure 4 TATDN1 positively regulated the methylation of miR-26b in BT-549 cells. (A) A CpG island was located in the promoter region of −5000 bp upstream of the miR-26b gene. (B) The sequence level detail of the miR-26b promoter region (−4817 to −4526 bp upstream of the miR-26b stem-loop). The effects of overexpression of TATDN1 (C), and silencing of TATDN1 on miR-26b gene methylation in BT-549 cells (D) were analyzed by MSP. Experiments were repeated in three biologically independent replicates and representative images were presented. (E) Statistical results of silencing of TATDN1 on the methylation level of miR-26b CpG islands region in breast cancer cells. Data are representative of three independent experiments and are presented as mean ± SD (**p < 0.01) (Student’s t-test). (F) Knockdown of TATDN1 decreased DNA methylation level of miR-26b CpG islands region in breast cancer cells analyzed by BSP. Each line indicates the cell samples. Each column indicates CpG sites which were marked in Figure 4B. The black squares indicate the methylation sites; while the empty squares indicate unmethylation sites.
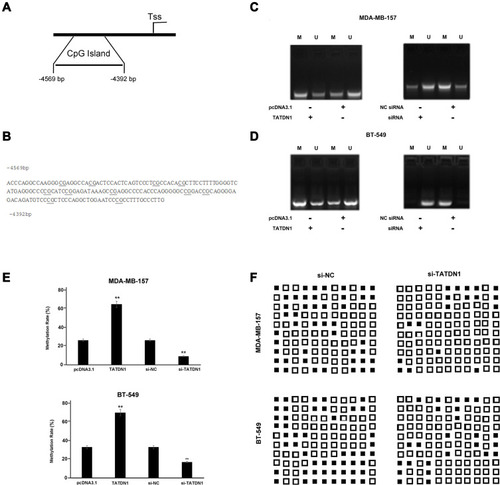
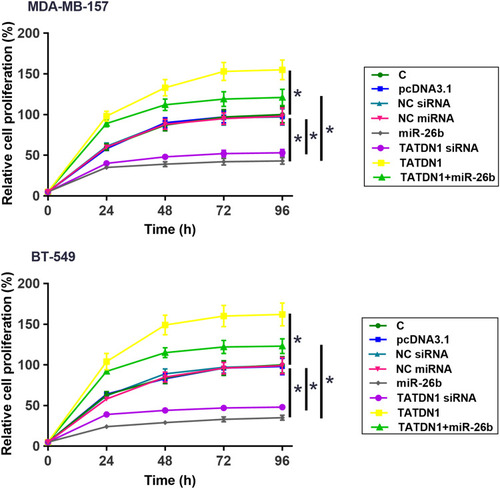
Figure 5 TATDN1 promoted the proliferation of TNBC cells through miR-26b. The effects of overexpression and silencing of TATDN1 as well as overexpression of miR-26b on the proliferation of TNBC cells were analyzed by CCK-8 assay. All PCR reactions were repeated in three biologically independent replicates and mean values were presented. *p < 0.05.