Figures & data
Figure 1 The expression of circCSNK1G1 was reinforced in CRC tissues and cells. (A) Differently expressed circCSNK1G1 in CRC tissues was obtained from the GEO dataset. (B) Schematic diagram was depicted to disclose the generation of circCSNK1G1. (C) The expression of circCSNK1G1 in CRC tumor tissues (n=55) and normal tissues (n=55) was detected by qRT-PCR. (D) The expression of circCSNK1G1 in NCM460, HCT116 and SW620 cells was detected by qRT-PCR. (E–H) The stability of circCSNK1G1 was checked using ActD and RNase R. (I and J) Nuclear and cytoplasmic RNA was isolated to identify the distribution of circCSNK1G1. *P<0.05.
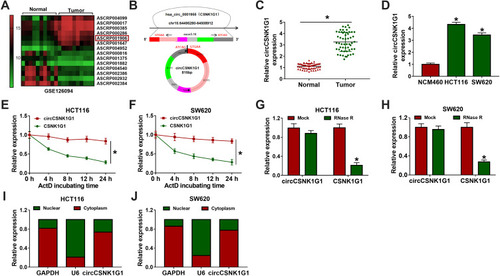
Figure 2 Silencing circCSNK1G1 blocked CRC development in vitro. (A and B) The expression of circCSNK1G1 in HCT116 and SW620 cells transfected with si-circCSNK1G1 or si-NC was measured by qRT-PCR. (C–E) Cell proliferation was assessed by MTT assay and colony formation assay after circCSNK1G1 knockdown. (F) Cell apoptosis was monitored by flow cytometry assay after circCSNK1G1 knockdown. (G and H) The expression of Bax, Bcl-2 and c-caspase-3 was measured by Western blot after circCSNK1G1 knockdown. (I and J) Cell cycle distribution was investigated by flow cytometry after circCSNK1G1 knockdown. (K and L) Cell migration and invasion were checked by transwell assay after circCSNK1G1 knockdown. *P<0.05.
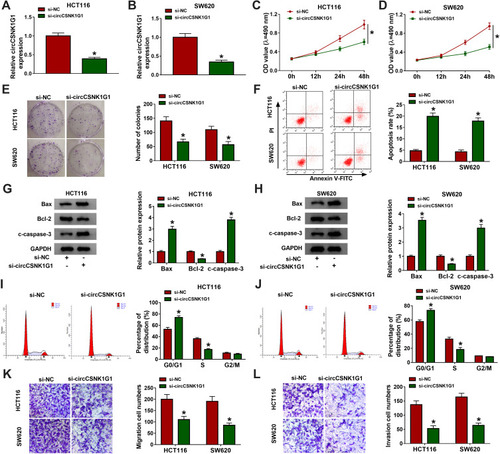
Figure 3 CircCSNK1G1 targeted miR-455-3p. (A) Using the bioinformatics tool starBase to predict the relationship between circCSNK1G1 and miR-455-3p. (B–D) Using dual-luciferase reporter assay and RNA pull-down assay to validate the interaction between circCSNK1G1 and miR-455-3p. (E) The expression of miR-455-3p in clinical tissues was measured by qRT-PCR. (F) The expression of circCSNK1G1 in cell lines was measured by qRT-PCR. (G) The expression of circCSNK1G1 in HCT116 and SW620 cells transfected with si-circCSNK1G1 was measured by qRT-PCR. *P<0.05.
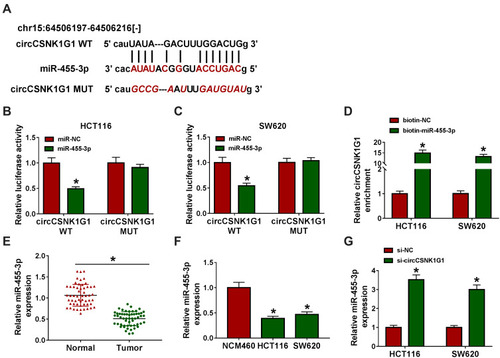
Figure 4 Silencing circCSNK1G1 blocked the development of CRC in vitro by increasing miR-455-3p. HCT116 and SW620 cells were introduced with si-circCSNK1G1, si-NC, si-circCSNK1G1+anti-miR-455-3p or si-circCSNK1G1+anti-miR-NC. (A and B) The expression of miR-455-3p in these transfected cells was examined by qRT-PCR. (C–E) Cell proliferation in these transfected cells was monitored by MTT assay and colony formation assay. (F) Cell apoptosis was examined using flow cytometry assay in these transfected cells. (G and H) The expression of Bax, Bcl-2 and c-caspase-3 was quantified by Western blot in these transfected cells. (I and J) Cell cycle distribution was checked by flow cytometry assay in these transfected cells. (K and L) Cell migration and invasion were examined using transwell assay in these transfected cells. *P<0.05.
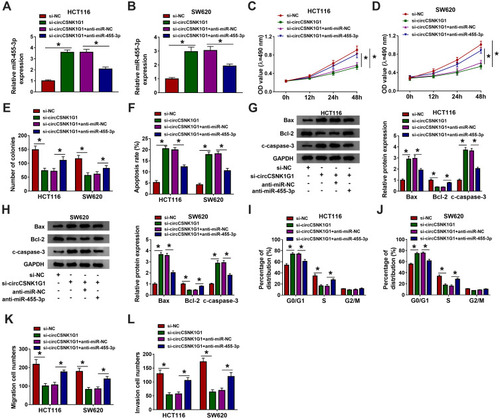
Figure 5 MYO6 was a target of miR-455-3p. (A) Using the bioinformatics tool starBase to predict the interaction between MYO6 and miR-455-3p. (B and C) Using dual-luciferase reporter assay to verify the interaction between MYO6 and miR-455-3p. (D) The expression of MYO6 in COAD tissues was acquired from the TCGA data. (E and F) The expression of MYO6 in clinical tissues was detected by qRT-PCR and Western blot. (G and H) The expression of MYO6 in cell lines was detected by qRT-PCR and Western blot. (I and J) The expression of MYO6 in HCT116 and SW620 cells transfected with miR-455-3p or miR-NC was detected by qRT-PCR and Western blot. (K and L) The expression of MYO6 in HCT116 and SW620 cells transfected with si-circCSNK1G1, si-NC, si-circCSNK1G1+anti-miR-455-3p or si-circCSNK1G1+anti-miR-NC was detected by qRT-PCR and Western blot. *P<0.05.
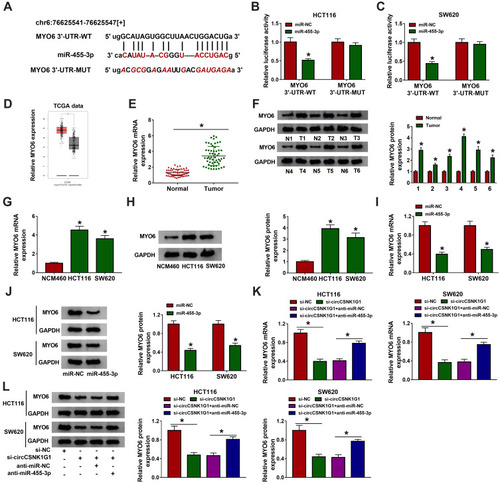
Figure 6 MiR-455-3p restoration blocked CRC development in vitro by targeting MYO6. HCT116 and SW620 cells were introduced with miR-455-3p, miR-NC, miR-455-3p+MYO6 or miR-455-3p+vector. (A) The expression of MYO6 in these transfected cells was quantified by Western blot. (B–D) Cell proliferation was evaluated by MTT assay and colony formation assay in indicated cells. (E) Cell apoptosis was investigated by flow cytometry assay in indicated cells. (F and G) The expression of Bax, Bcl-2 and c-caspase-3 in indicated cells was quantified by Western blot. (H and I) Cell cycle distribution in indicated cells was monitored using flow cytometry assay. (J and K) Cell migration and invasion in indicated cells were determined using transwell assay. *P<0.05.
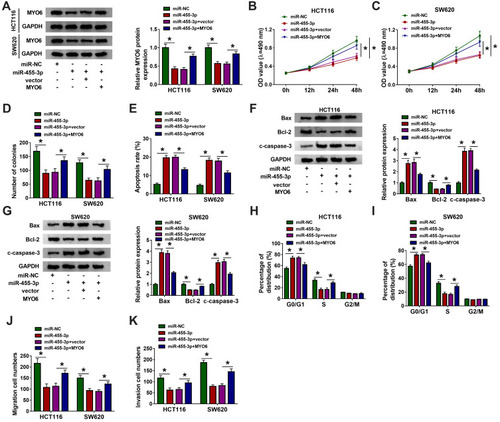
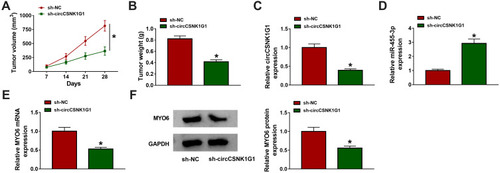
Figure 7 CircCSNK1G1 knockdown suppressed tumor growth in vivo via the miR-455-3p/MYO6 axis. (A and B) After injection, tumor volume was measured once a week, and tumor weight was measured after 28 days. (C–E) The expression of circCSNK1G1, miR-455-3p and MYO6 in these removed tissues was detected by qRT-PCR. (F) The expression of MYO6 in the removed tissues was also detected by Western blot. *P<0.05.