Figures & data
Table 1 Regulation of Gene Expression After 24-Hour Treatment with Aspirin and Salicylic Acid
Figure 1 REDD1 expression in various cell lines. (A) Effect of aspirin and salicylic acid treatment on REDD1 expression in MDA-MB-468, MCF-7, MDA-MB-231, and MCF10A cell lines. Cells were exposed to 2 mM of aspirin (ASA), salicylic acid (SA), or vehicle control (C) for 24 hours. Equal amounts of proteins (50 µg) from vehicle or drug-treated cells were loaded on each lane of SDS-PAGE gel for electrophoresis, followed by transfer onto PVDF membranes, which were then probed with anti-REDD1 antibody. β-actin was used as loading control. Densitometric quantification of REDD1 levels were normalized to β-actin for fold change calculations. Data are expressed as means±SD of at least three independent experiments. *P<0.05 (vs vehicle control) by Student’s t-test. (B) Baseline levels of REDD1 in non-treated cells.
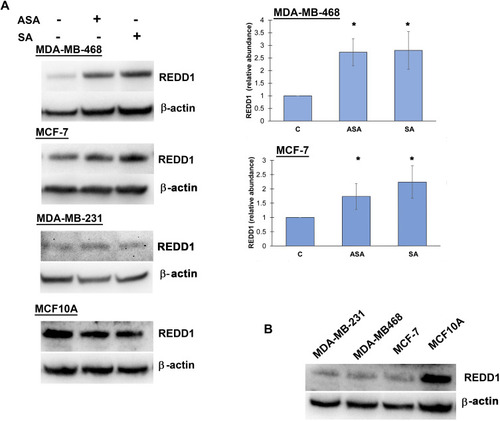
Figure 2 Aspirin and salicylic acid attenuate mTORC1 signaling in breast cancer and non-cancerous breast epithelial cells. Cells were exposed to 2 mM of aspirin (ASA), salicylic acid (SA), or vehicle control (C) for 24 (MDA-MB-468, MCF10A) or 17 (MCF-7, MDA-MB-231) hours. Equal amounts of proteins (50 µg) from vehicle or drug-treated cells were loaded on each lane of SDS-PAGE gel for electrophoresis, followed by transfer onto PVDF membranes, which were then probed with respective antibody. β-actin was used as loading control. (A) Data for MDA-MB-468 cell line are expressed as means±SD of four independent experiments. *P<0.05 (vs vehicle control) by Student’s t-test. (B) One experiment was performed in MCF-7, MDA-MB-231, and MCF10A cell lines.
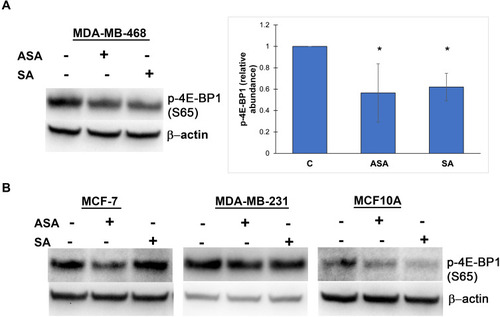
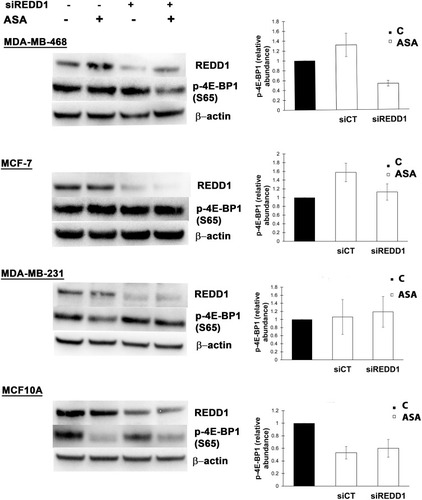
Figure 3 Different effects of REDD1 silencing on aspirin-mediated expression of phosphorylated 4E-BP1. Cells were transfected with non-targeting (siCT) or REDD1 siRNA (siREDD1) for 24 (MDA-MB-468, MCF-7, MDA-MB-231 cell lines) or 48 hours (MCF10A) and treated with vehicle control (C) or 2 mM of aspirin (ASA) for the next 24 hours before cell lysis. Equal amounts of proteins (50 µg) were loaded on each lane of SDS-PAGE gel for electrophoresis, followed by transfer onto PVDF membranes, which were then probed with respective antibody. β-actin was used as loading control. REDD1 was probed on a different blot than p-4E-BP1. Data are expressed as means±SD from three independent experiments for MDA-MB-468, MCF-7, MDA-MB-231, and from two independent experiments for MCF10A.