Figures & data
Table 1 Relationship Between SLC16A1-AS1 Expression and Clinical Pathological Characteristics of GBM Patients
Table 2 Sequences of Primers Used in PCR
Figure 1 Overexpression of SLC16A1-AS1 is correlated with the poor survival of GBM patients. Expression of SLC16A1-AS1 in GBM and paired non-tumor tissues was determined by RT-qPCR. Mean values of three technical replicates were presented and compared between paired tissues using paired t-test (A), ***p < 0.001. The 62 patients were divided into high and low SLC16A1-AS1 level groups (n = 31). The cutoff value was the median level of SLC16A1-AS1 expression in GBM tissues. Survive curves were plotted based on the 2 years’ follow-up data. Log-rank test was used to compare survival curves (B).
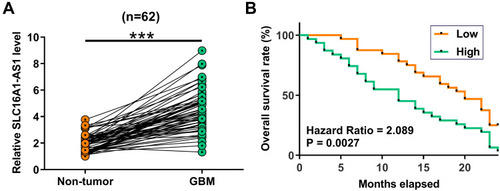
Figure 2 MiR-149 was downregulated in GBM and inversely correlated with SLC16A1-AS1. Expression of miR-149 in paired GBM and non-tumor tissues was also determined by RT-qPCR. Mean values of three technical replicates were presented and compared between paired tissues using paired t-test (A), ***p < 0.001. Correlations between levels of miR-149 and SLC16A1-AS1 expression across GBM tissues (B and C) were analyzed by linear regression.
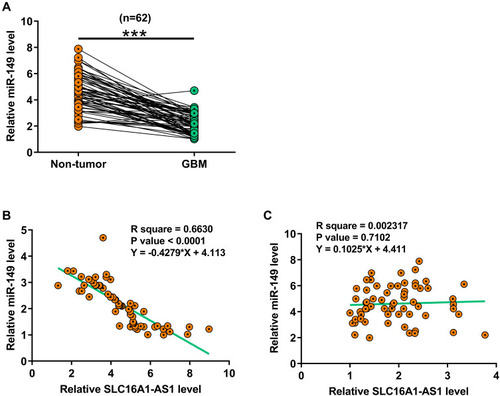
Figure 3 Overexpression of SLC16A1-AS1 downregulated miR-149 through methylation in U87 and U-118 MG cells. To explore the possible interaction between SLC16A1-AS1 and miR-149, U87 and U-118 MG cells were transfected with either SLC16A1-AS1 expression vector or miR-149 mimic. RT-qPCR was performed to confirm the overexpression of SLC16A1-AS1 and miR-149 in U87 and U-118 MG cells (A). The effects of SLC16A1-AS1 overexpression on miR-149 (B) and the effects of miR-149 overexpression on SLC16A1-AS1 (C) were also explored by RT-qPCR. MSP was performed to analyze the effects of SLC16A1-AS1 overexpression on the methylation of miR-149 gene (D). BSP was also performed in U87 cell lines to detect the overall methylation status of miR-149, the result showed SLC16A1-AS1 increase the methylation levels compared to control cell (58.3% versus 23.3%) (E). M, methylation; U, unmethylation; ○: CpG site unmethylation; ●: CpG site methylation; mean values were presented and compared, *p < 0.05.
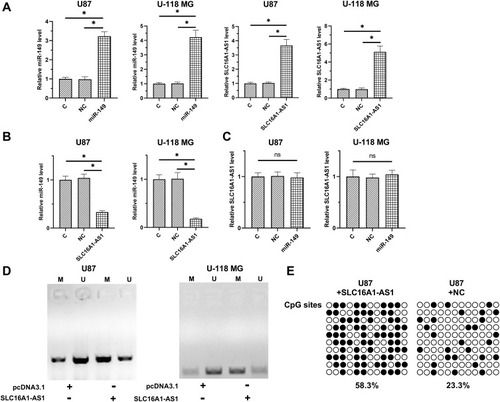
Figure 4 SLC16A1-AS1 reduced the inhibitory effects of miR-149 on U87 and U-118 MG cell proliferation. The proliferation of U87 (A) and U-118 MG (B) cells with overexpression of SLC16A1-AS1 and/or miR-149 was analyzed by CCK-8 assay. Cell proliferation was recorded every 24 h for a total of 96 h. Colony formation assay was also showed overexpression of SLC16A1-AS1 could increase the tumor cell expansion, but this effect would be reversed by miR-149 (C). Mean values of three replicates were presented and compared, *p < 0.05.
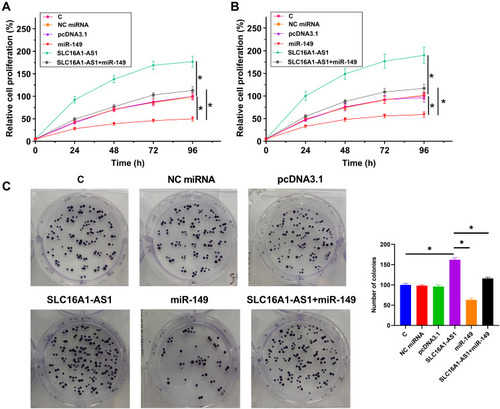
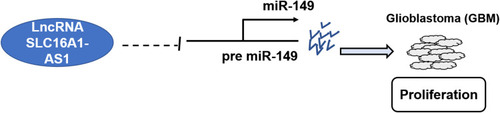
Figure 5 The schematic model of SLC16A1-AS1 by inhibiting miR-149 involved in the progression of GBM.