Figures & data
Figure 1 The expression of circFLNA in GC tissues and cells. (A) Heat map revealed the differentially expressed circRNAs in GC tumor tissues (Tumor) and adjacent normal tissues (Normal) (GEO accession: GSE141977). (B) The expression of circFLNA in Tumor and Normal was detected by qRT-PCR. (C) CircFLNA expression in the tissues of GC patients with different TNM stages (I+II and III+IV) was measured by qRT-PCR. (D) QRT-PCR was used to determine the expression of circFLNA in GC cell lines (HGC27 and AGS) and normal gastric mucosal cell line (GES-1). ***P < 0.001, ****P < 0.0001.
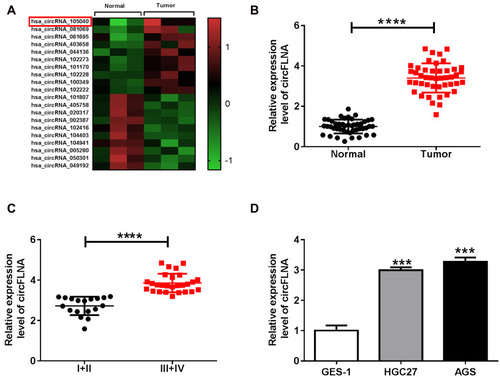
Figure 2 CircFLNA knockdown inhibited GC cell progression and GC tumor growth. (A-B) The transfection efficiencies of sh-circFLNA#1/#2/#3 were confirmed by detecting circFLNA expression using qRT-PCR. (C-G) HGC27 and AGS cells were transfected with sh-NC or sh-circFLNA#3. CCK8 assay (C-D), transwell assay (E-F) and flow cytometry (G) were performed to measure cell proliferation, migration, invasion and apoptosis, respectively. (H-I) AGS cells transfected with sh-NC or sh-circFLNA#3 were injected into the nude mice to build GC tumor xenograft models. Tumor volume (H) and tumor weight (I) were measured in mice. *P < 0.05, **P < 0.01, ***P < 0.001.
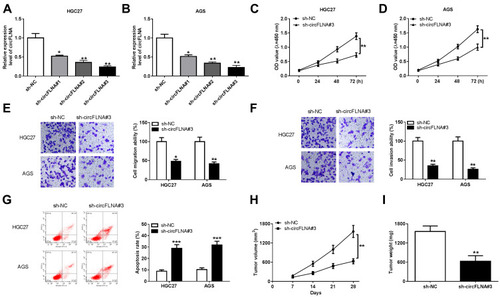
Figure 3 CircFLNA silencing inhibited the glycolysis of GC cells. HGC27 and AGS cells were transfected with sh-NC or sh-circFLNA#3. The lactate production (A), glucose consumption (B) and ATP level (C) of cells were detected using Lactate Assay Kit, Glucose Assay Kit and ATP Assay Kit, respectively. (D) Glucose uptake was measured using Glucose Uptake Assay Kit. *P < 0.05, **P < 0.01.
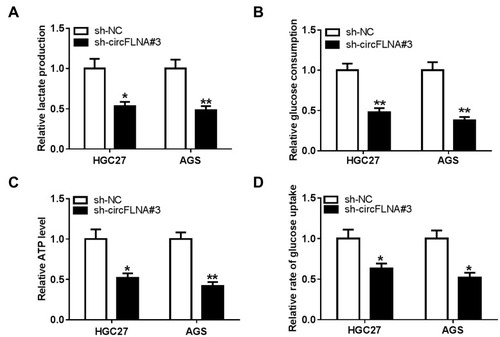
Figure 4 CircFLNA could sponge miR-646 in GC. (A) Diagram of putative and mutative miR-646 binding sites in circFLNA were presented. (B-C) Dual-luciferase reporter assay was used to detect the relative activities of circFLNA WT and circFLNA MUT reporters in HGC27 and AGS cells transfected with miR-646 or miR-NC. (D) RIP assay was performed to measure the enrichment of circFLNA on RIP-Ago2 or RIP-IgG in HGC27 and AGS cells transfected with miR-646 or miR-NC. (E) The expression of miR-646 in GC tumor tissues (Tumor) and adjacent normal tissues (Normal) was detected by qRT-PCR. (F) QRT-PCR was employed to examine the expression of miR-646 in GC cell lines (HGC27 and AGS) and GES-1 cells. (G) The correlation between circFLNA and miR-646 was analyzed using Pearson correlation analysis. (H) The transfection efficiency of pcDNA circFLNA overexpression plasmid was assessed by qRT-PCR. (I) The expression of miR-646 was detected by qRT-PCR in HGC27 and AGS cells transfected with pcDNA circFLNA overexpression plasmid or pcDNA. **P < 0.01, ***P < 0.001, ****P < 0.0001.
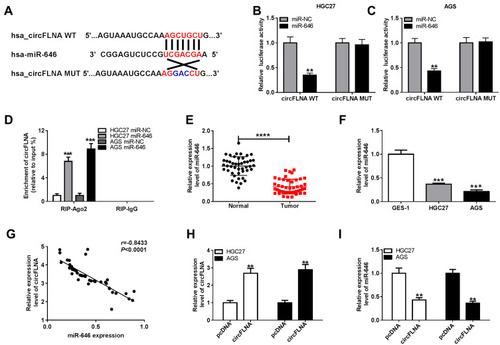
Figure 5 Effects of miR-646 inhibitor and circFLNA silencing on GC progression. HGC27 and AGS cells were transfected with sh-NC, sh-circFLNA#3, sh-circFLNA#3 + in-miR-NC or sh-circFLNA#3 + in-miR-646. (A) QRT-PCR was used to detect the expression of miR-646. CCK8 assay (B-C), transwell assay (D-E) and flow cytometry (F) were used to determine the proliferation, migration, invasion and apoptosis, respectively. The lactate production (G), glucose consumption (H) and ATP level (I) of cells were measured by Lactate Assay Kit, Glucose Assay Kit and ATP Assay Kit, respectively. (J) Glucose Uptake Assay Kit was employed to evaluate the glucose uptake of cells. *P < 0.05, **P < 0.01, ***P < 0.001.
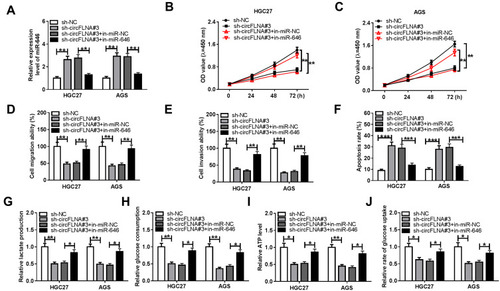
Figure 6 PFKFB2 could serve as a target of miR-646 in GC. (A) The putative and mutative miR-646 binding sites in PFKFB2 3ʹUTR were shown. (B-C) The relative activities of PFKFB2 3ʹUTR WT and PFKFB2 3ʹUTR MUT reporters in HGC27 and AGS cells transfected with miR-646 or miR-NC were detected by dual-luciferase reporter assay. (D) The protein expression of PFKFB2 in GC tumor tissues (Tumor) and adjacent normal tissues (Normal) was measured by WB analysis. (E) WB analysis was employed to assess the protein expression of PFKFB2 in GC cell lines (HGC27 and AGS) and GES-1 cells. The correlation between PFKFB2 and miR-646 (F) or PFKFB2 and circFLNA (G) was analyzed using Pearson correlation analysis. (H) The protein expression of PFKFB2 in HGC27 and AGS cells transfected with miR-646 mimic or miR-NC was examined by WB analysis. (I) WB analysis was employed to assess the protein expression of PFKFB2 in HGC27 and AGS cells transfected with sh-NC, sh-circFLNA#3, sh-circFLNA#3 + in-miR-NC or sh-circFLNA#3 + in-miR-646. *P < 0.05, **P < 0.01, ***P < 0.001, ****P < 0.0001.
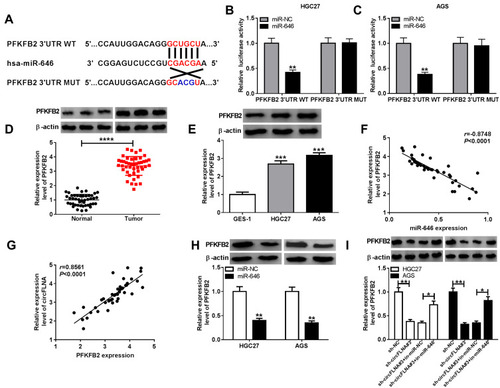
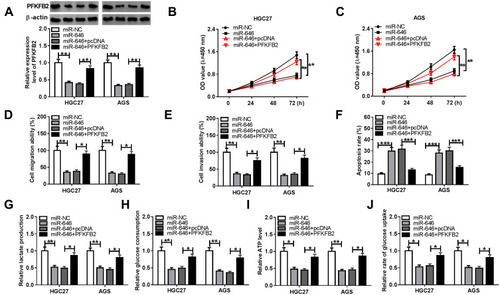
Figure 7 Effects of PFKFB2 overexpression and miR-646 on GC progression. HGC27 and AGS cells were transfected with miR-NC, miR-646, miR-646 + pcDNA or miR-646 + PFKFB2. (A) WB analysis was used to detect the protein expression of PFKFB2. The proliferation, migration, invasion and apoptosis of cells were measured using CCK8 assay (B-C), transwell assay (D-E) and flow cytometry (F), respectively. The lactate production (G), glucose consumption (H) and ATP level (I) of cells were determined using Lactate Assay Kit, Glucose Assay Kit and ATP Assay Kit, respectively. (J) The glucose uptake of cells was assessed using Glucose Uptake Assay Kit. *P < 0.05, **P < 0.01, ***P < 0.001.