Figures & data
Figure 1 TW-37 and ABT-263 cotreatment synergistically inhibited the viability of RCC cells. (A) RCC cell lines (786-O and Caki-1) were treated with various doses of TW-37 (0 μM, 5 μM, 10 μM, 20 μM) and ABT-263 (0 μM, 10 μM, 20 μM, 40 μM) for 24 h, then cell viability was measured by MTT assay. (B) RCC cell lines (786-O and Caki-1) were treated with different combinations of TW-37 and ABT-263 (5 μM + 10 μM; 10 μM + 20 μM; 20 μM + 40 μM), then cell viabilities were assayed at various time points (6 h, 12 h, 24 h). (C) Combination index (CI) of TW-37 and ABT-263 in RCC cells were calculated using the Chou-Talalay method (CompuSyn). Fa: Fraction affected. Data was presented as mean±SD. Experiments were performed at least three times. *p<0.05; **p<0.01 vs. control group.
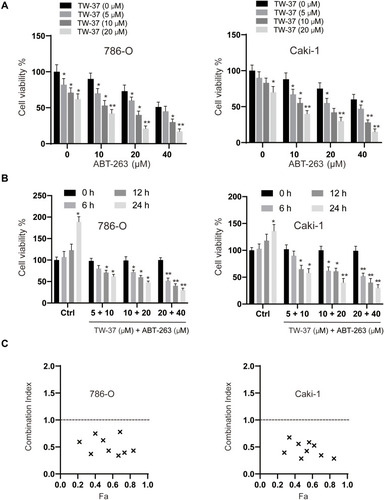
Figure 2 The effects of TW-37 and ABT-263 cotreatment on the colony formation, migration, invasion and cell cycle distribution of RCC cells. RCC cells were treated TW-37 (20 μM), ABT-263 (40 μM) or their combination. (A) Two weeks later, the colony formation ability was assayed. (B) 48 h later, migration of RCC cells was measured. (C) 48 h later, invasion of RCC cells was measured. (D) 48 h later, cellular lysates were subjected to Western blot analysis with indicated antibodies. (E) 48 h later, cell cycle distribution was assayed. (F) 48 h later, cellular lysates were subjected to Western blot analysis with indicated antibodies. Data was presented as mean±SD. Experiments were performed at least three times. *p<0.05; **p<0.01; ***p<0.001 vs. control group.
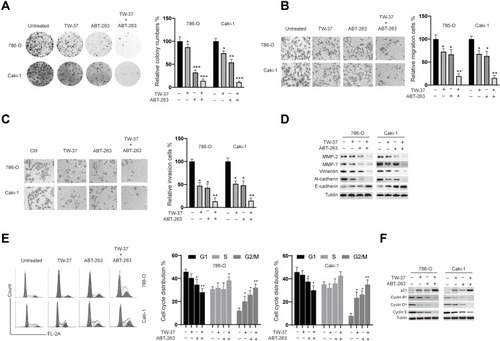
Figure 3 TW-37 and ABT-263 cotreatment synergistically induced apoptosis in RCC cells. RCC cells were treated with TW-37 (20 μM), ABT-263 (40 μM) or their combination for 24 h. (A) Cellular apoptosis rates were measured using the apoptosis nucleosome ELISA assay. (B) Caspase-3 activity was assayed. (C) the expression of indicated proteins were measured using the Western blotting assay. (D) the activation of Bax (top) and release of mitochondrial proteins (bottom) were assayed. (E) cells were co-treated with TW-37 and ABT-263 in the presence of zVAD.fmk or not for 24 h, then cellular apoptosis was measured. (F) RCC cells were transfected with siRNAs for 24 h, the level of Bax was measured by Western blotting (left). Transfected cells were co-treated with TW-37 and ABT-263, the release of mitochondrial proteins was assayed (right). (G) RCC cells were transfected with siRNAs for 24 h, then cells were co-treated with TW-37 and ABT-263 for another 24 h and the cleavage of caspase-3 was measured by Western blotting. (H) RCC cells were transfected with siRNAs for 24 h, then cells were co-treated with TW-37 and ABT-263 for another 24 h and cellular apoptosis was assayed. (I) RCC cells were transfected with siRNAs for 24 h, then cells were co-treated with TW-37 and ABT-263 for another 24 h and activity of caspase-3 was assayed. Data was presented as mean±SD. Experiments were performed at least three times. *p<0.05; **p<0.01.
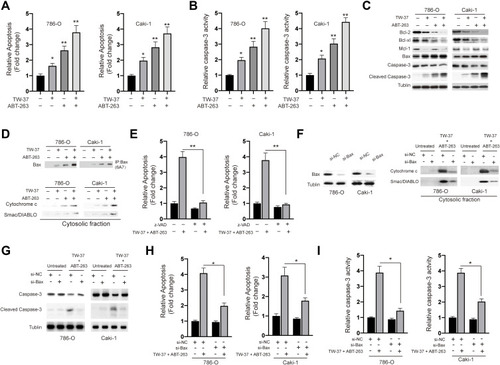
Figure 4 TW-37 and ABT-263 cotreatment lead to the activation of ERK signaling pathway. (A) RCC cells were treated with TW-37 (20 μM), ABT-263 (40 μM) or their combination for 24 h, then total cellular lysates were subjected to Western blotting analysis with indicated antibodies. (B) RCC cells were pretreated with various specific inhibitors for 4 h, then cells were incubated with TW-37 in combination with ABT-263 for another 24 h, cellular apoptosis was measured. (C) RCC cells were pretreated with various specific inhibitors for 4 h, then cells were incubated with TW-37 in combination with ABT-263 for another 24 h, the cleavage of caspase-3 was measured by Western blotting. (D) RCC cells were pretreated with various specific inhibitors for 4 h, then cells were incubated with TW-37 in combination with ABT-263 for another 24 h, the activation of Bax and release of mitochondrial proteins were assayed. Data was presented as mean±SD. Experiments were performed at least three times. **p<0.01 vs. control group.
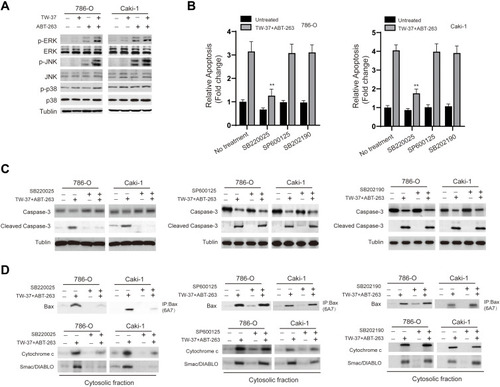
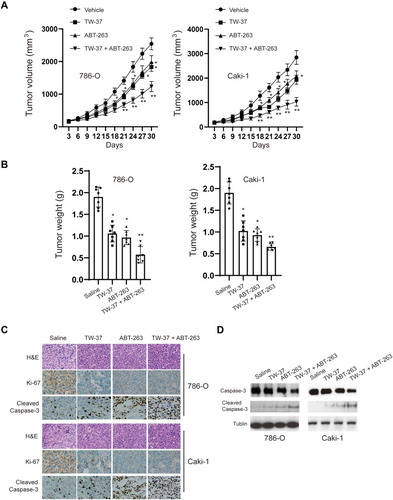
Figure 5 TW-37 and ABT-263 synergistically inhibited the growth of tumor in xenograft mice model. (A) Tumor-bearing nude mice were treated with vehicle, TW-37 (10 mg/kg), and/or ABT-263 (10 mg/kg) for 30 days, and tumor sizes were measured every 3 days. (B) Mice were sacrificed 30 days after treatment, tumor weights were measured. (C) H&E staining and Immunohistochemical (IHC) analysis for changes of Ki-67 and cleaved-caspase 3 expression in harvested tumors after different treatments as indicated. Representative images are shown (magnification: ×40). (D) Western blotting analysis of cleavage of caspase-3 in collected tumors from different groups. *p<0.05; **p<0.01 vs. control group.