Figures & data
Figure 1 miR-4449 was aberrantly expressed in colorectal cancer. (A). The expression of miR-4449 was analyzed in microarray data of GSE115513 (411 colon tumors and 381 normal colon mucosa). (B). The expression of miR-4449 in 50 pairs of colorectal tumors and the matched normal tissues were detected by RT-qPCR. (C). Comparison of miR-4449 expression in normal colon tissues and colorectal tumors of different stages (Stage 1, Stage 2, Stage 3 and Stage 4). (D). The expression of miR-4449 in the immortalized colon cell line NCM460 and colorectal cancer cell lines HCT116, SW480 and HT29 was detected by RT-qPCR. **p<0.01; ***p<0.001.
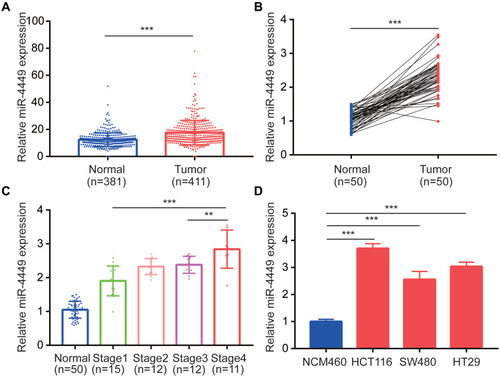
Figure 2 miR-4449 regulated STAT3 pathway in colorectal cancer cells. (A). The expression of miR-4449 in HCT116 and SW480 cells with transfection of miR-NC or miR-4449 inhibitor. (B–C). Protein expression of p-STAT3, STAT3 and β-actin were detected by Western blotting in HCT116 (B) and SW480 (C) cells with transfection of miR-NC or miR-4449 inhibitor. (D, E). The mRNA levels of VEGF, c-Myc and BIRC5 were detected in HCT116 (D) and SW480 (E) cells with transfection of miR-NC or miR-4449 inhibitor by RT-qPCR. **p<0.01; ***p<0.001.
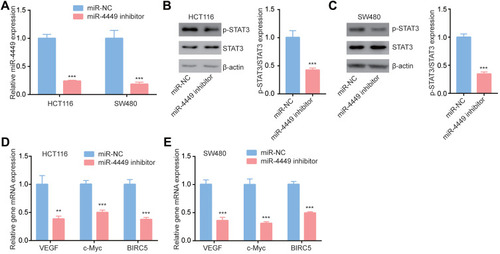
Figure 3 SOCS3 mRNA levels were negatively associated with miR-4449 expression. (A). There was a putative binding site for miR-4449 on SOCS3 3ʹUTR. (B). The SOCS3 mRNA levels were detected in 50 pairs of colorectal tumors and normal tissues by RT-qPCR. (C). Pearson correlation analysis of SOCS3 expression and miR-4449 expression in 50 colorectal tumors. ***p<0.001.
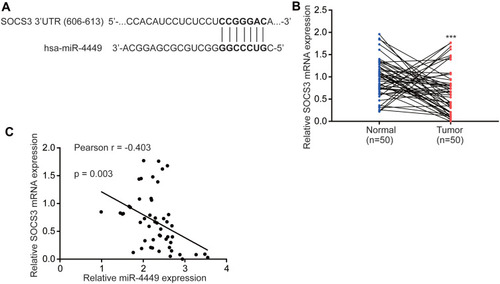
Figure 4 miR-4449 regulated SOCS3 expression in colorectal cancer cells. (A, B). The SOCS3 protein expression was detected in HCT116 (A) and SW480 (B) cells with transfection of miR-NC or miR-4449 inhibitor. (C). The SOCS3 mRNA levels were detected in HCT116 and SW480 cells with transfection of miR-NC or miR-4449 inhibitor. (D). The miR-4449 levels were detected in HCT116 and SW480 cells with transfection of miR-NC or miR-4449 mimic. (E, F). SOCS3, p-STAT3 and STAT3 protein expression were detected in HCT116 (E) and SW480 (F) cells with transfection of miR-NC or miR-4449 mimic. (G). The sequence alignment among miR-4449, SOCS3 3ʹUTR wild type and SOCS3 3ʹUTR mutant (3ʹUTR-M) was presented. (H). The luciferase activity was detected in HCT116 and SW480 cells with transfection of miR-NC or miR-4449 mimic in combination with SOCS3 3ʹUTR. (I). The luciferase activity was detected in HCT116 and SW480 cells with transfection of miR-NC or miR-4449 mimic in combination with SOCS3 3ʹUTR-M. **p<0.01; ***p<0.001.
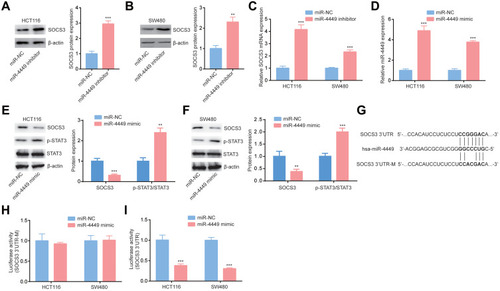
Figure 5 miR-4449 regulated STAT3 signaling via targeting SOCS3. (A, B) The SOCS3 protein expression was detected in HCT116 (A) and SW480 (B) cells with transfection of control siRNA or SOCS3 siRNA. (C) Protein expression of p-STAT3, STAT3 and β-actin was detected in HCT116 cells with transfection of miR-NC or miR-4449 inhibitor in combination with control siRNA or SOCS3 siRNA by Western blotting. (D) The mRNA levels of VEGF, c-Myc and BIRC5 were detected in HCT116 cells with transfection of miR-NC or miR-4449 inhibitor in combination with control siRNA or SOCS3 siRNA by RT-qPCR. (E) Protein expression of p-STAT3, STAT3 and β-actin was detected in SW480 cells with transfection of miR-NC or miR-4449 inhibitor in combination with control siRNA or SOCS3 siRNA by Western blotting. (F) The mRNA levels of VEGF, c-Myc and BIRC5 were detected in SW480 cells with transfection of miR-NC or miR-4449 inhibitor in combination with control siRNA or SOCS3 siRNA by RT-qPCR. * vs control p<0.05; ** vs control p<0.01; *** vs control p<0.001; andand vs control p<0.01; and vs control p<0.001; # vs miR-4449 inhibitor p<0.05; ## vs miR-4449 inhibitor p<0.01; ### vs SOCS3 siRNA p<0.001; && vs control p<0.01; &&& vs control p<0.001.
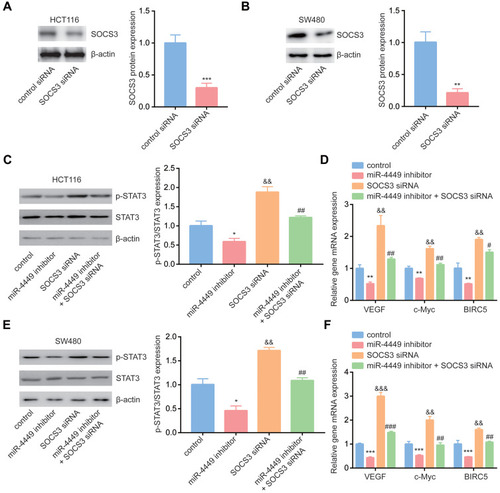
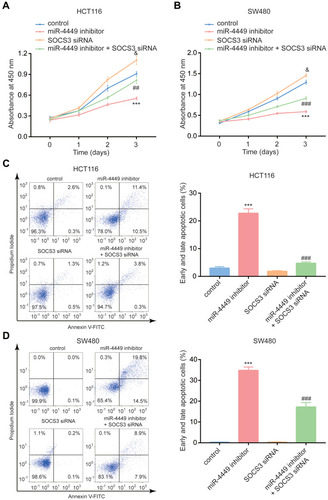
Figure 6 The miR-4449/SOCS3 axis regulated colorectal cancer cell proliferation and apoptosis. (A, B) The CCK-8 assay was used to detect cell proliferation of HCT116 (A) and SW480 (B) cells with transfection of miR-NC or miR-4449 inhibitor in combination with control siRNA or SOCS3 siRNA. C-D. The flow cytometry was used to detect cell apoptosis of HCT116 (C) and SW480 (D) cells with transfection of miR-NC or miR-4449 inhibitor in combination with control siRNA or SOCS3 siRNA. *** vs control p<0.001; and vs control p<0.05; ## vs miR-4449 inhibitor p<0.01; ### vs miR-4449 inhibitor p<0.001; & vs control p<0.05.